Important: The GCConnex decommission will not affect GCCollab or GCWiki. Thank you and happy collaborating!
Difference between revisions of "M365/Accueil/PowerBI"
| (45 intermediate revisions by 3 users not shown) | |||
| Line 1: | Line 1: | ||
{{DISPLAYTITLE:<span style="position: absolute; clip: rect(1px 1px 1px 1px); clip: rect(1px, 1px, 1px, 1px);">{{FULLPAGENAME}}</span>}} | {{DISPLAYTITLE:<span style="position: absolute; clip: rect(1px 1px 1px 1px); clip: rect(1px, 1px, 1px, 1px);">{{FULLPAGENAME}}</span>}} | ||
| − | + | '''Old Page Alert:''' ''Please note that you are currently on our old page. Our new and improved page can now be found at https://wiki.gccollab.ca/M365. Please update your bookmark.'' | |
| − | |||
| − | |||
| − | |||
| − | |||
| − | + | '''Alerte à l’ancienne page :''' ''Veuillez noter que vous êtes actuellement sur notre ancienne page. Notre nouvelle page améliorée se trouve maintenant à https://wiki.gccollab.ca/M365. Veuillez mettre à jour votre signet.'' | |
| − | |||
| − | + | <multilang> | |
| − | + | <!-- English section starts here --> | |
| − | + | @en| | |
| + | <!-- English template --> | ||
| + | [[Image:MS365_Banner_-_PowerBI.png|alt="M365 Home"|M365 Home|920px|link=https://wiki.gccollab.ca/M365/Home]] | ||
| + | {{MS_icons_EN}} | ||
| + | {{PowerBI_EN}} | ||
| − | + | <!-- French section starts here --> | |
| − | + | @fr| | |
| − | + | <!-- French template --> | |
| − | + | [[Image:MS365_Banner_-_PowerBI.png|alt="Accueil M365|Accueil M365|920px|link=https://wiki.gccollab.ca/M365/Accueil]] | |
| − | + | {{MS_icons_FR}} | |
| − | + | {{PowerBI_FR}} | |
| − | + | </multilang> | |
| − | |||
| − | |||
| − | |||
| − | |||
| − | |||
| − | |||
| − | |||
| − | { | ||
| − | |||
| − | |||
| − | |||
| − | |||
| − | |||
| − | |||
| − | |||
| − | |||
| − | |||
| − | |||
| − | |||
| − | |||
| − | |||
| − | { | ||
| − | |||
| − | |||
| − | |||
| − | |||
| − | |||
| − | |||
| − | |||
| − | |||
| − | |||
| − | |||
| − | |||
| − | |||
| − | |||
| − | |||
| − | |||
| − | |||
| − | |||
| − | |||
| − | |||
| − | |||
| − | |||
| − | |||
| − | |||
| − | |||
| − | |||
| − | |||
| − | |||
| − | |||
| − | |||
| − | + | <!-- Templates used on this page --> | |
| − | + | <!-- English: https://wiki.gccollab.ca/Template:PowerBI_EN --> | |
| − | + | <!-- French: https://wiki.gccollab.ca/Template:PowerBI_FR ---> | |
| − | < | ||
Latest revision as of 09:44, 1 June 2023
Old Page Alert: Please note that you are currently on our old page. Our new and improved page can now be found at https://wiki.gccollab.ca/M365. Please update your bookmark.
Alerte à l’ancienne page : Veuillez noter que vous êtes actuellement sur notre ancienne page. Notre nouvelle page améliorée se trouve maintenant à https://wiki.gccollab.ca/M365. Veuillez mettre à jour votre signet.
Introduction - Power BI
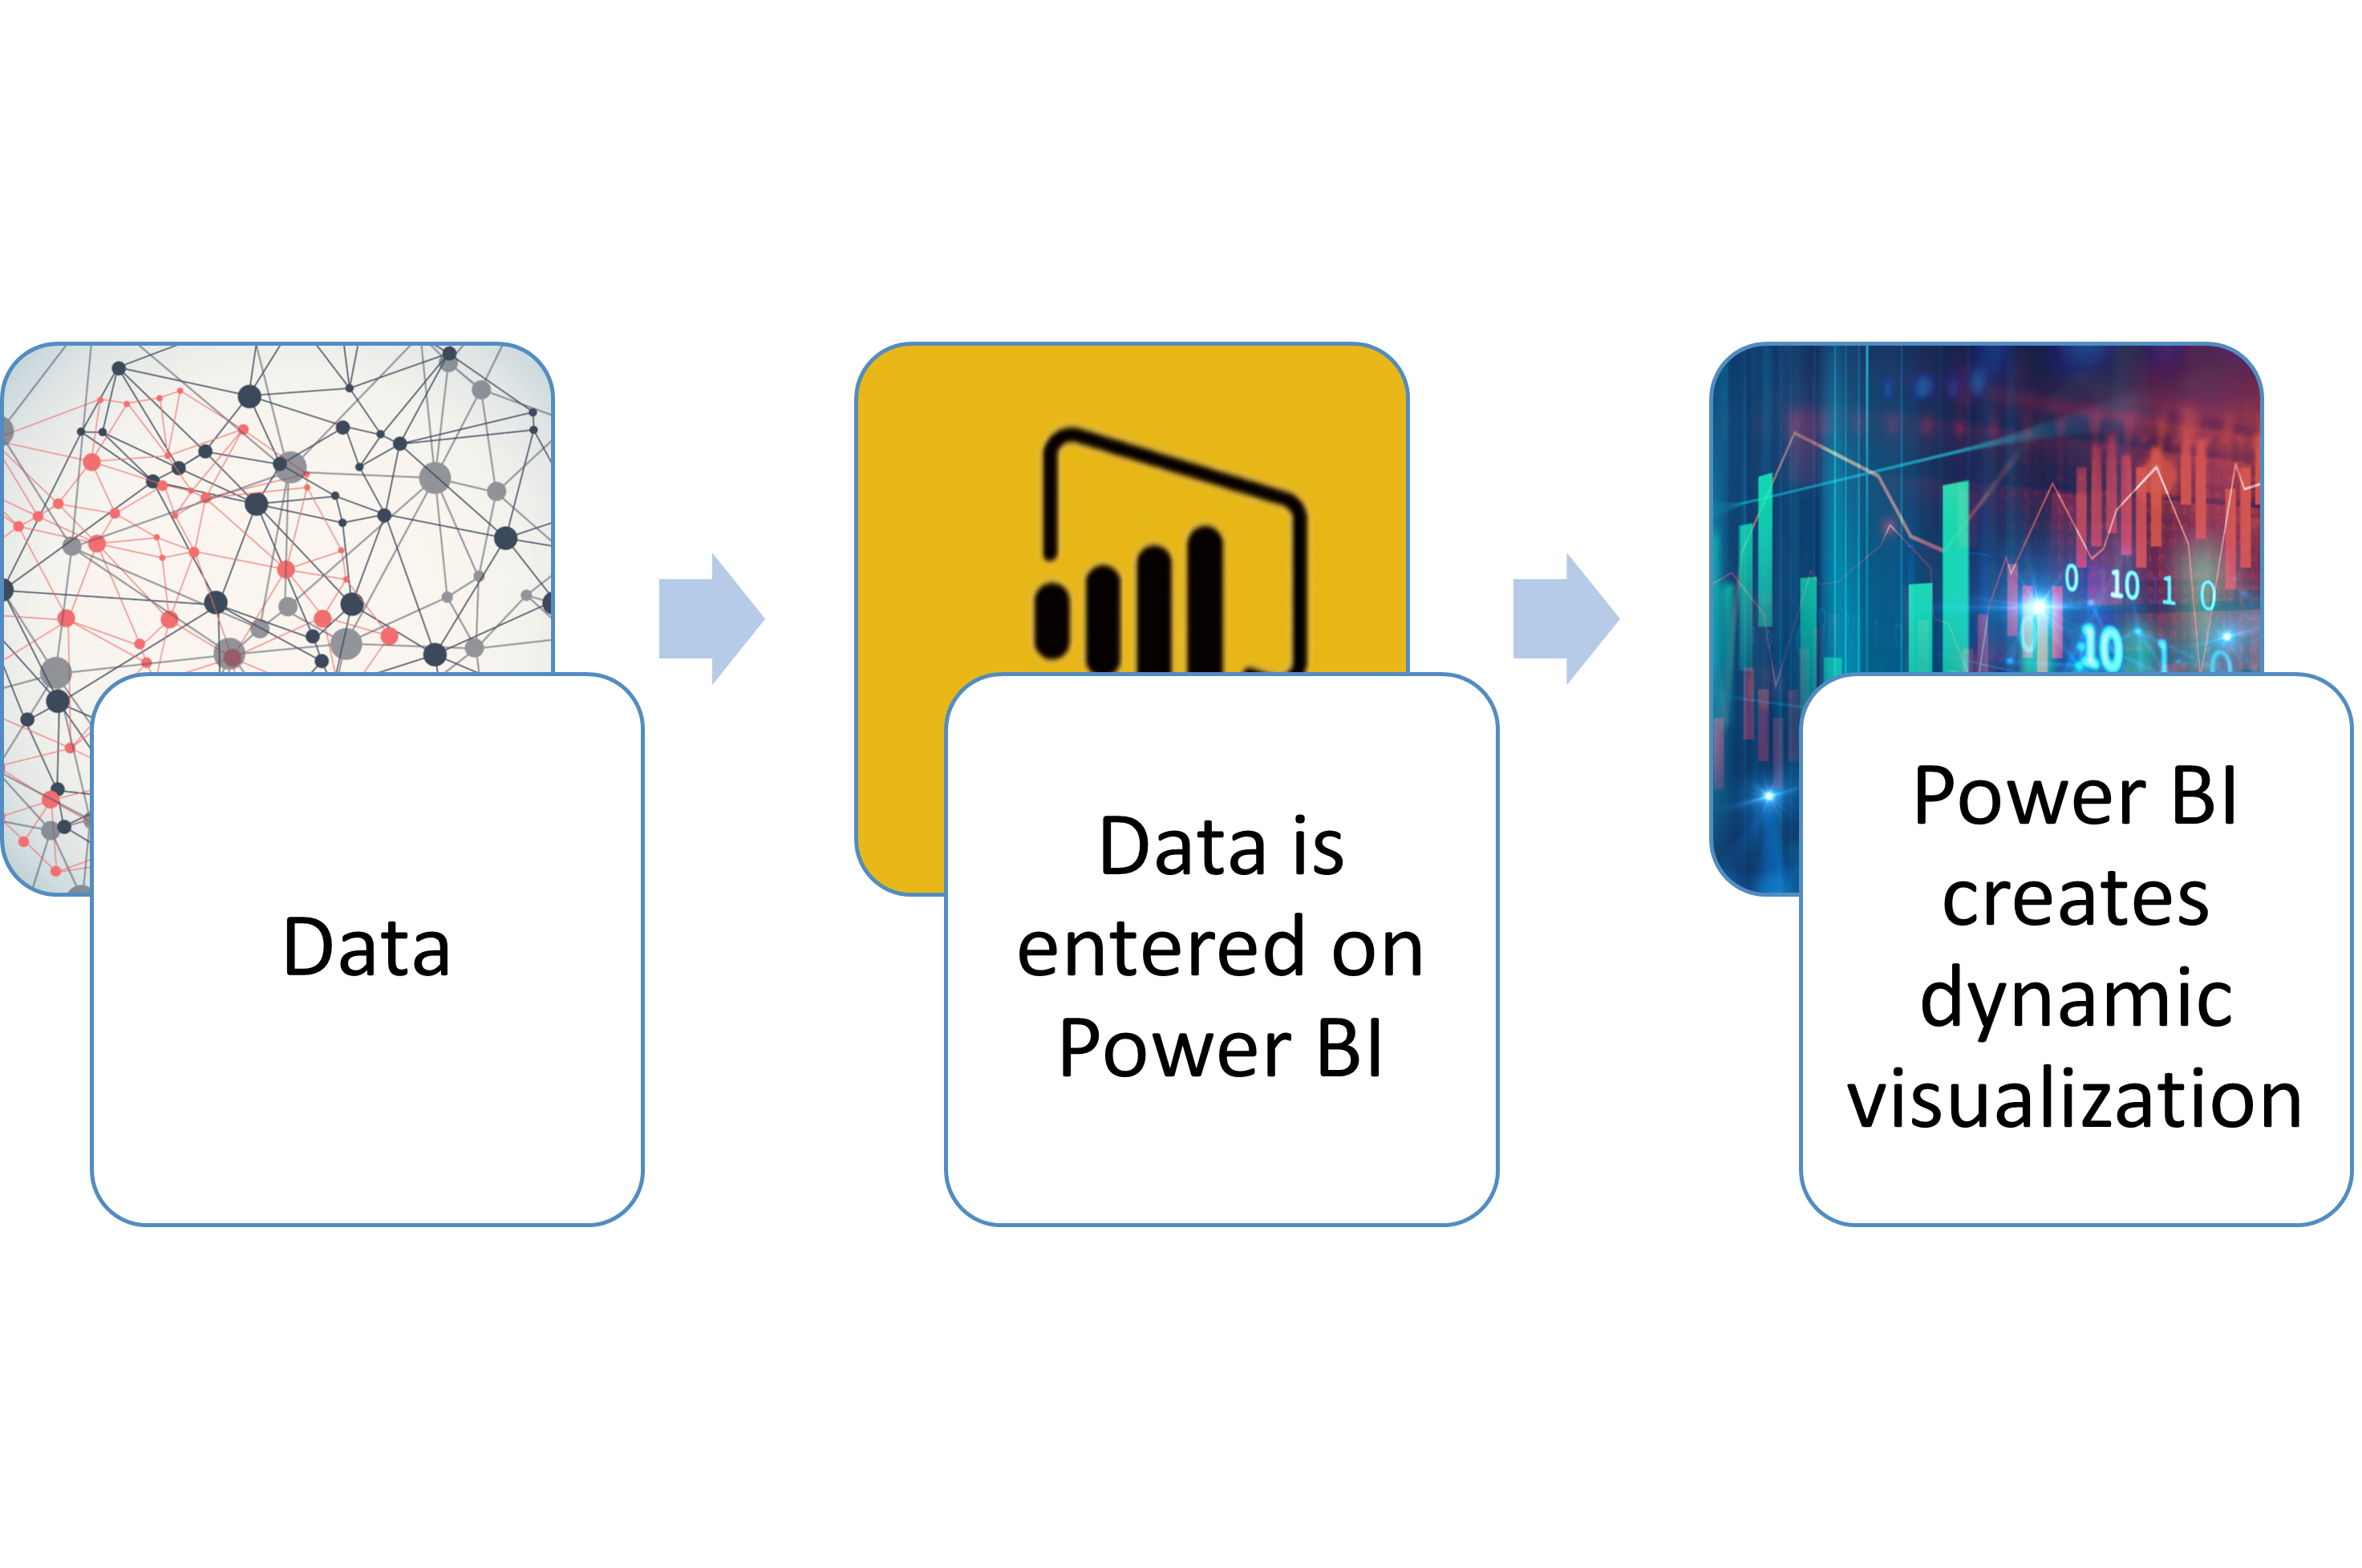
Power BI is an MS365 application that allows users to connect to and visualize any data using a scalable platform for self-service and enterprise business intelligence (BI). This platform is easy to use, is unified and helps you gain deeper data insight. Microsoft defines Power BI as a visual tool to bridge the gap between data and decision-making.[1]
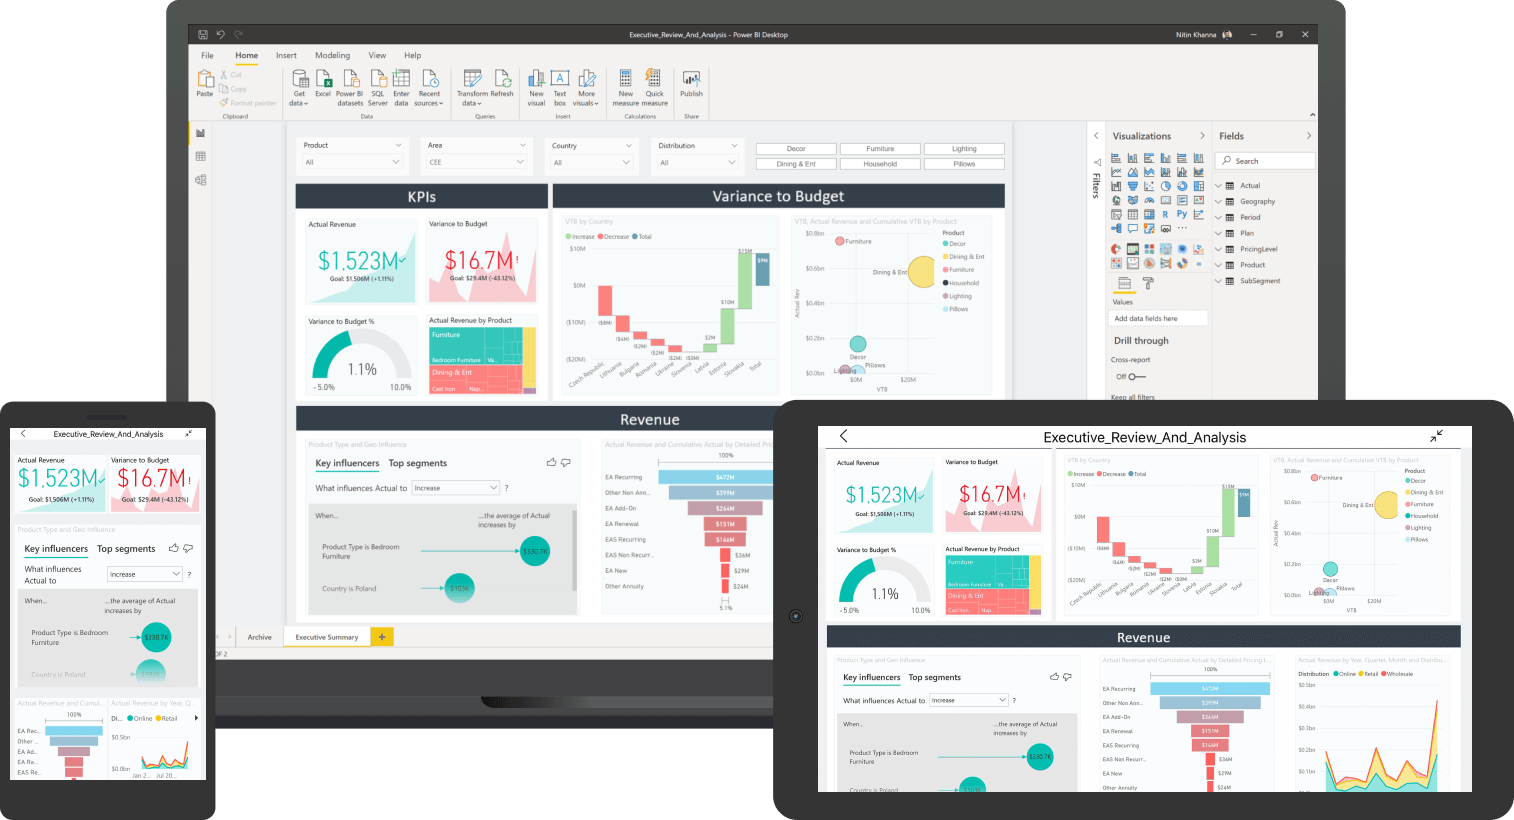
Power BI is a collection of software services, apps, and connectors that work together to turn your unrelated sources of data into coherent, visually immersive, and interactive insights. It converts data from different sources to build interactive dashboards and Business Intelligence reports.[2]
Power BI at work
How you use Power BI may depend on your role in a project or on a team. For example, you might primarily use the Power BI service to view reports and dashboards. Your coworkers might make extensive use of Power BI Desktop or Power BI Report Builder to create reports, then publish those reports to the Power BI service, where you can view them. Another coworker, in procurement, might mainly use the Power BI phone app to monitor progress on sales quotas and to drill into new lead details. [1]
If you are a developer, you might use Power BI APIs to push data into datasets or to embed dashboards and reports into your own custom applications.[2]
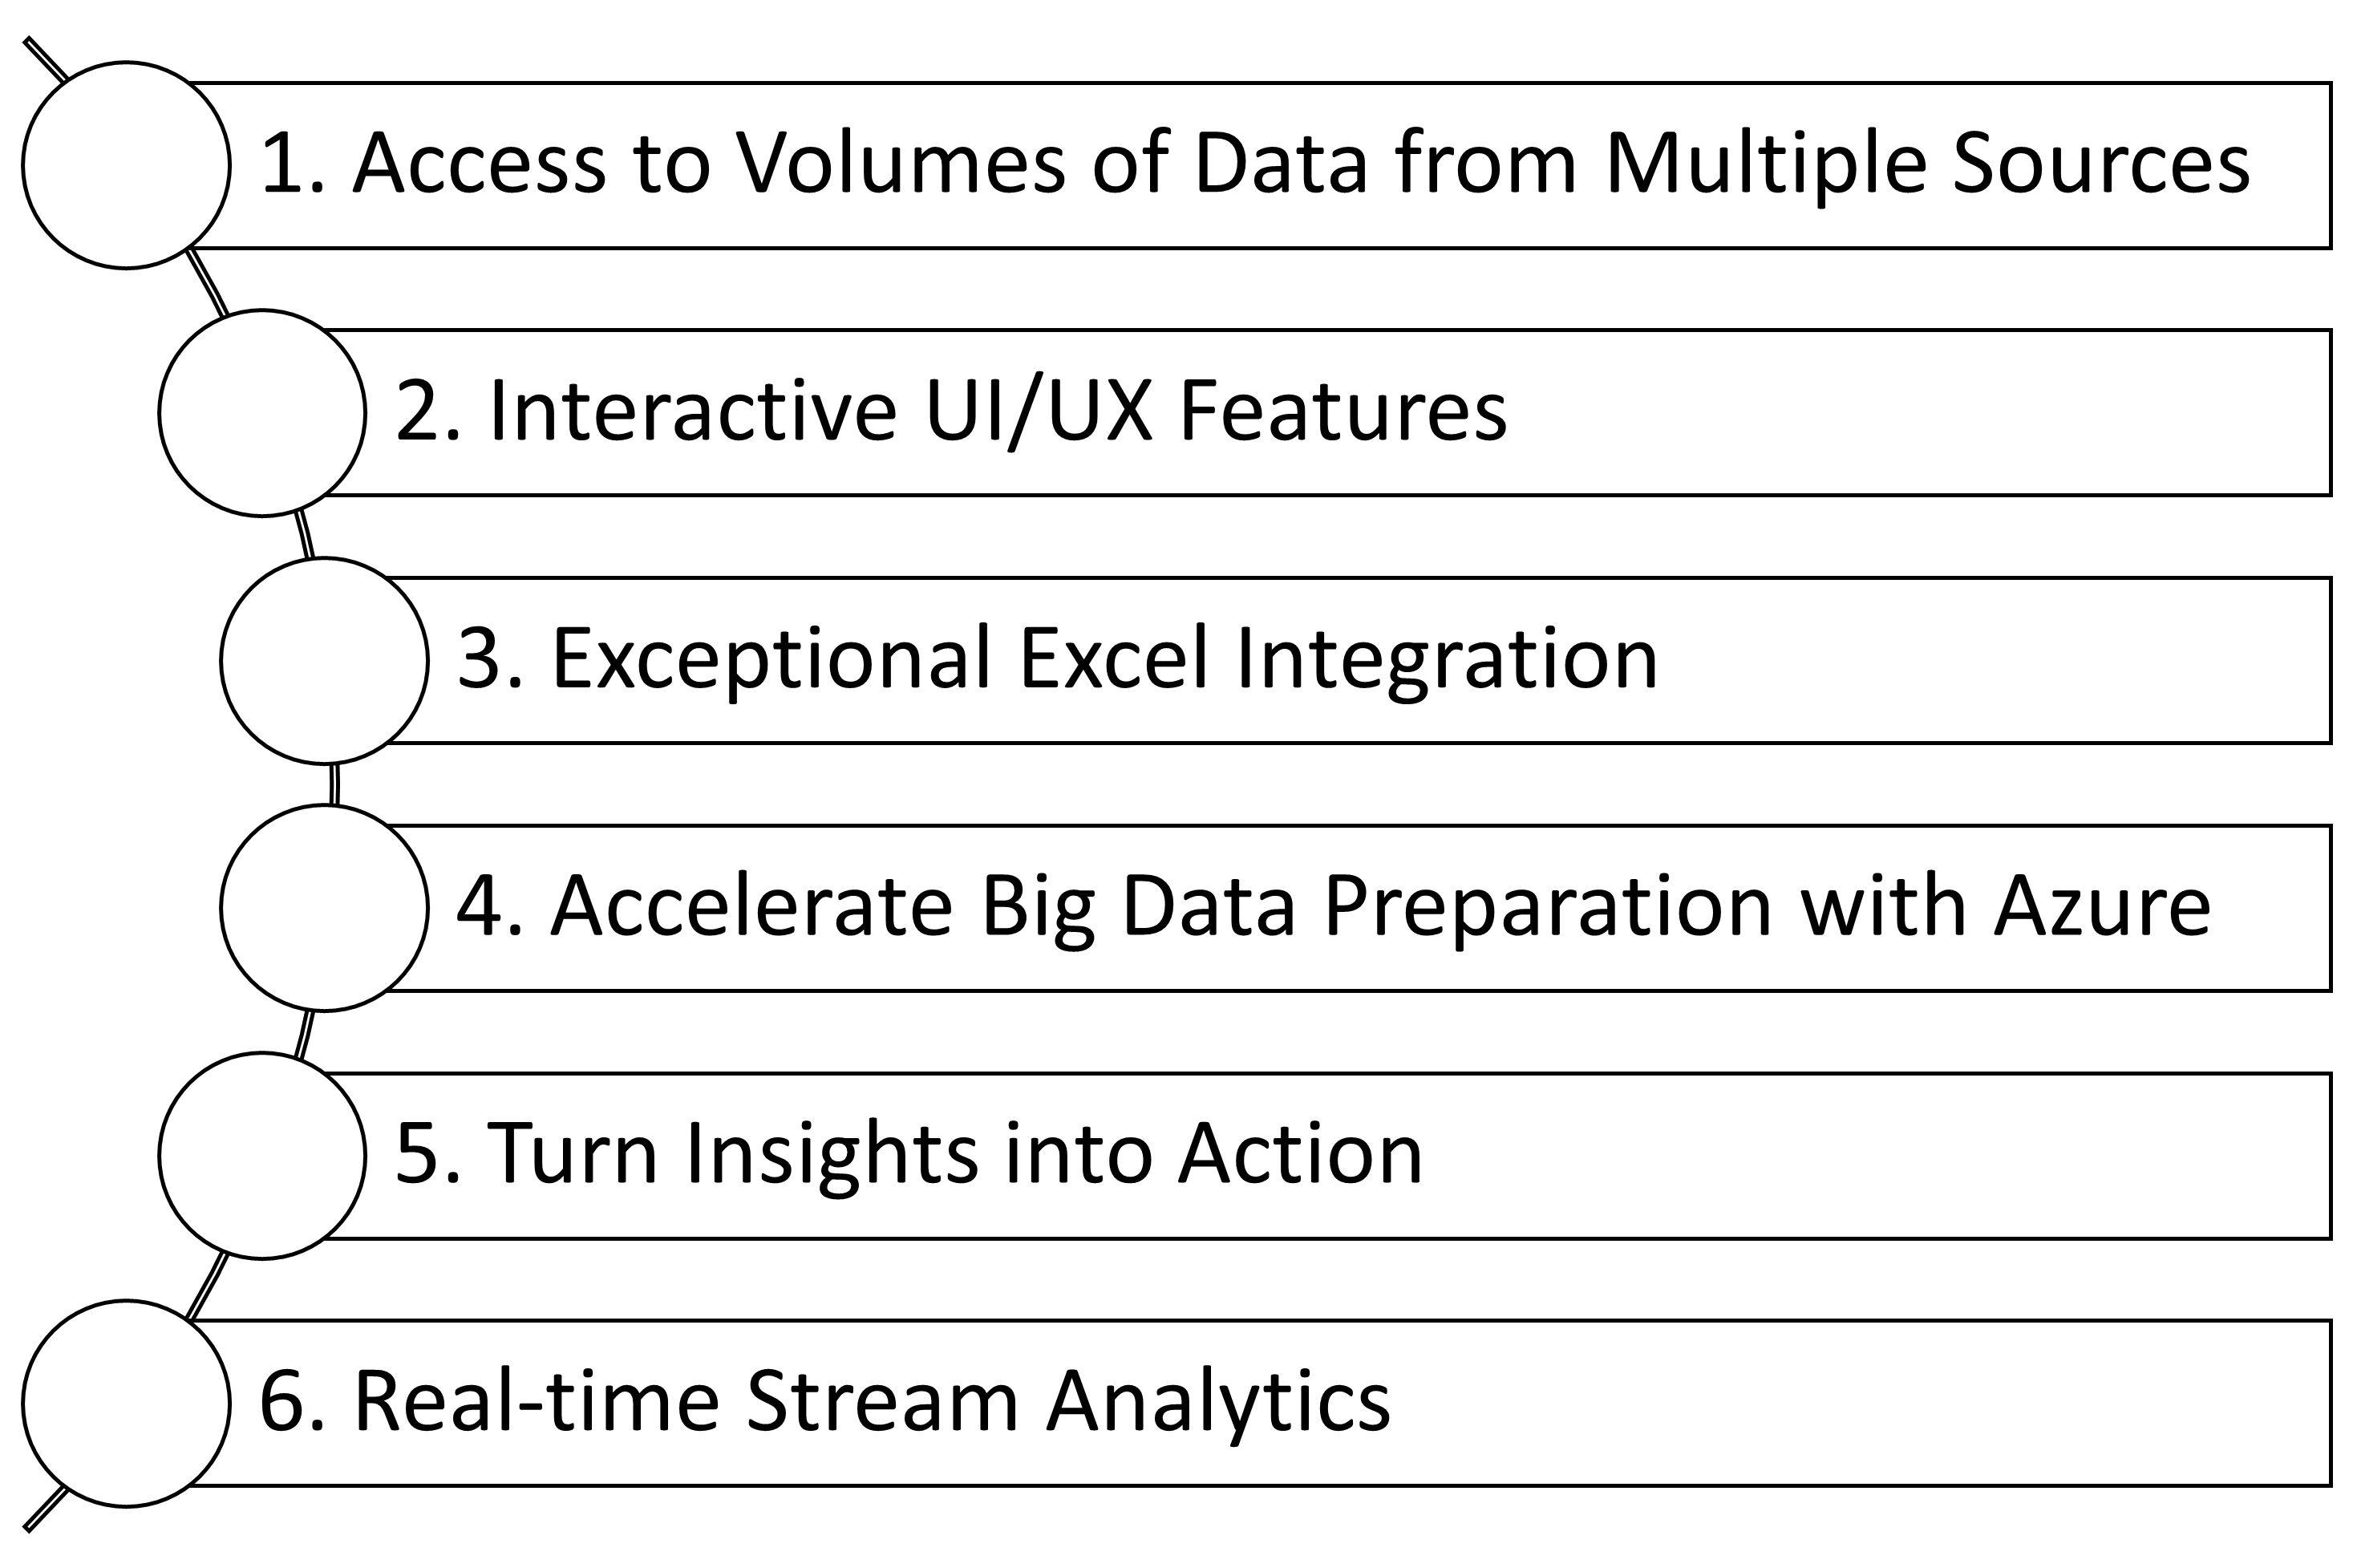
What are the main functionalities of Power BI[3]
1. Access to Volumes of Data from Multiple Sources
Power BI can access big data from a variety of sources. It allows you to view, analyze, and visualize vast quantities of data that cannot be opened, or processed in Excel. Some of the important data sources available for Power BI are Excel, XLS, TXT, CSV, XML, JSON, pdf, etc. Power BI uses powerful compression algorithms to import and cache the data within the PBIX file.
2. Interactive user interface or user experience (UI/UX) features
Power BI makes things visually more appealing. It has an easy drag and drop functionality, with features that allow you to copy all formatting across similar visualizations.
3. Exceptional Excel Integration
Power BI helps to gather, analyze, publish, and share Excel business data. Anyone familiar with Office 365 can easily connect Excel queries, data models, and reports to Power BI Dashboards.
4. Accelerate Big Data Preparation with Azure
Using Power BI with Azure allows you to analyze and share massive volumes of data. Azure data sets can reduce the time it takes to get insights and increase collaboration between business analysts, data engineers, and data scientists.
5. Turn Insights into Action
Power BI allows you to gain understanding of your data and turn that information into actions to make data-driven business decisions.
6. Real-time Stream Analytics
Power BI will enable you to perform real-time stream analytics. It helps you fetch data from multiple sources, including social media, or social engagement tools to get access to real-time analytics, so you are always ready to make business decisions based on your BI.
Power BI - Training Materials
Below is a collection of Microsoft Power BI training products to support public servants.
Virtual Training
Additional Resources
Disclaimer: SSC provides these links to resources for your convenience. However, these resources reside outside of the Government of Canada and may not adhere to GC standards.
- What is Power BI? (Microsoft)
- Get started with Power BI Desktop (Microsoft)
- Use the Power BI web part (Microsoft)
- Embed Power BI content in Microsoft Teams (Microsoft)
- Power BI videos (Microsoft)
- Introduction to Microsoft Power Platform for developers (Microsoft)
Learning Paths
- Click here to find over 20 learning Path modules (Microsoft)
- Get started with Power BI (Microsoft)
- Get data with Power BI Desktop (Microsoft)
- Explore data in Power BI (Microsoft)
- Explore what Power BI can do for you (Microsoft)
- Publish and share in Power BI (Microsoft)
- Use DAX in Power Bi Desktop (Microsoft)
- Consume data with Power BI (Microsoft)
- Describe the business value of the Microsoft Power Platform (Microsoft)
- Create and use analytics reports with Power BI (Microsoft)
Discussion Board
Do you have a question about Power BI? Simply click here to join the Microsoft Power BI Community hub to join the community and get started.
Contact Us
References and other resources


