Important: The GCConnex decommission will not affect GCCollab or GCWiki. Thank you and happy collaborating!
Difference between revisions of "Immigration, Emigration and Retention (Under Development)"
| (10 intermediate revisions by the same user not shown) | |||
| Line 1: | Line 1: | ||
| − | [[File:Outmigration Presentation 20191009.pptx|thumb]][[File:Number of Emigrants from Canada.png|right|frameless]] | + | [[File:Outmigration Presentation 20191009.pptx|thumb]][[File:Number of Emigrants from Canada.png|right|frameless]] |
| + | |||
| + | ==Emigration== | ||
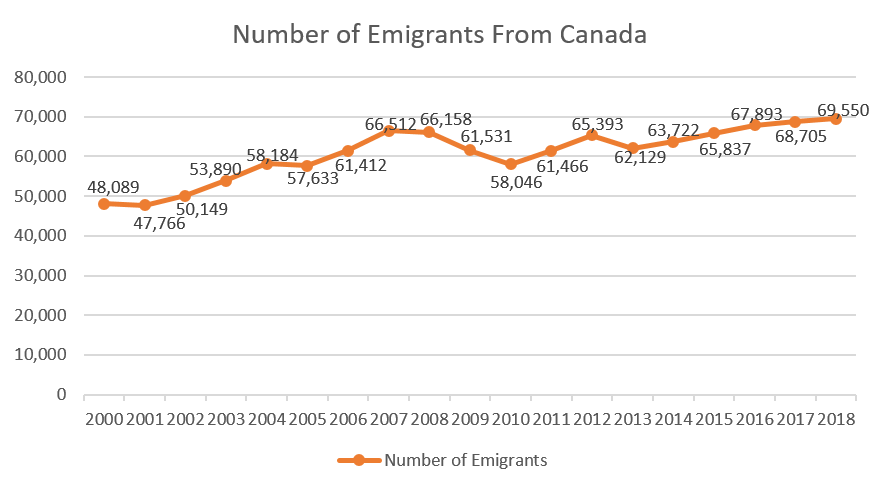
Permanent emigration refers to Canadian citizens or landed immigrants who leave Canada to acquire permanent residency in another country, while temporary emigration refers to Canadian citizens and immigrants living temporarily abroad who have not maintained a usual place of residence in Canada | Permanent emigration refers to Canadian citizens or landed immigrants who leave Canada to acquire permanent residency in another country, while temporary emigration refers to Canadian citizens and immigrants living temporarily abroad who have not maintained a usual place of residence in Canada | ||
| − | + | ==Outmigration== | |
The action of leaving one place to settle in another, especially within a country. | The action of leaving one place to settle in another, especially within a country. | ||
| − | + | ==Immigrant Retention== | |
Increased immigration is designed to tackle the issue of retention, but once permanent resident status is issued, a newcomer is free to live anywhere in Canada. And in a significant number of cases, they decide to leave. Simply increasing immigration will not solve economic and demographic issues in Atlantic Canada. The real challenge is immigrant retention. New Brunswick, Newfoundland & Labrador, Nova Scotia and Prince Edward Island are all struggling with the economic impact of an aging population and shrinking labour force. Between 2011 and 2015, Nova Scotia retained 72 per cent of its immigrants, compared to 56 per cent in Newfoundland & Labrador, 52 per cent in New Brunswick and just 18 per cent in Prince Edward Island. Every other Canadian province has a retention rate of 80 per cent or more. | Increased immigration is designed to tackle the issue of retention, but once permanent resident status is issued, a newcomer is free to live anywhere in Canada. And in a significant number of cases, they decide to leave. Simply increasing immigration will not solve economic and demographic issues in Atlantic Canada. The real challenge is immigrant retention. New Brunswick, Newfoundland & Labrador, Nova Scotia and Prince Edward Island are all struggling with the economic impact of an aging population and shrinking labour force. Between 2011 and 2015, Nova Scotia retained 72 per cent of its immigrants, compared to 56 per cent in Newfoundland & Labrador, 52 per cent in New Brunswick and just 18 per cent in Prince Edward Island. Every other Canadian province has a retention rate of 80 per cent or more. | ||
| − | {| class="FCK__ShowTableBorders" style="background: none transparent scroll repeat 0% 0 | + | |
| + | [http://gcdocs2.ci.gc.ca/otcsdav/enterprise/5.1%20Internal%20Services/Governance%20and%20Management%20Support/Management%20and%20Oversight%20Services/Strategic%20policy%20and%20planning%20and%20Government%20Relations/Strategic%20Planning/Strategic%20Policy%20and%20Planning%20Branch/Modelling%20and%20Analysis/Project/Labour%20Market%20Intelligence/Ad%20hoc/2019/Canada%20Business%20with%20Francophonie%20countries/PTs_Terr%20Business%20with%20Top%2020%20%20Franco.url PTs/Territories Business with Top 20 Franco Countries] | ||
| + | {| class="FCK__ShowTableBorders" width="100%" style="background: none transparent scroll repeat 0% 0%" | ||
|- | |- | ||
| − | ! style="background: # | + | ! style="background: #cee6f2; color: #ff0000" | <font size="3">[[Emigration/Outmigration Estimates|<span style="color: #ff0000">Emigration/Outmigration Estimates</span>]]</font> |
| − | ! style="background: # | + | ! style="background: #cee6f2; color: #00ffff" | <font size="3">[[Retention|<span style="color: #ff0000">Retention</span>]]</font> |
| − | ! style="background: # | + | ! style="background: #cee6f2; color: #00ff00" | <font size="3">[[Determinants of Outmigration|<span style="color: #ff0000">Determinants of Outmigration</span>]]</font> |
| − | ! style="background: # | + | ! style="background: #cee6f2; color: #00ff00" | <font size="3">[[Tracking and Monitoring Outmigration|<span style="color: #ff0000">Tracking and Monitoring Outmigration</span>]]</font> |
| − | ! style="background: # | + | ! style="background: #cee6f2; color: #00ff00" | <font size="3">[[Impacts of Outmigration|<span style="color: #ff0000">Impacts of Outmigration</span>]]</font> |
| − | ! style="background: # | + | ! style="background: #cee6f2; color: #00ff00" | <font size="3">[[Policy and Research Implications|<span style="color: #ff0000">Policy and Research Implications</span>]]</font> |
|- | |- | ||
| colspan="6" | | | colspan="6" | | ||
| Line 24: | Line 28: | ||
|} | |} | ||
| + | |||
| + | [[Category: Immigration]] | ||
| + | __NOEDITSECTION__ | ||
Latest revision as of 14:25, 17 December 2019
File:Outmigration Presentation 20191009.pptx
Emigration
Permanent emigration refers to Canadian citizens or landed immigrants who leave Canada to acquire permanent residency in another country, while temporary emigration refers to Canadian citizens and immigrants living temporarily abroad who have not maintained a usual place of residence in Canada
Outmigration
The action of leaving one place to settle in another, especially within a country.
Immigrant Retention
Increased immigration is designed to tackle the issue of retention, but once permanent resident status is issued, a newcomer is free to live anywhere in Canada. And in a significant number of cases, they decide to leave. Simply increasing immigration will not solve economic and demographic issues in Atlantic Canada. The real challenge is immigrant retention. New Brunswick, Newfoundland & Labrador, Nova Scotia and Prince Edward Island are all struggling with the economic impact of an aging population and shrinking labour force. Between 2011 and 2015, Nova Scotia retained 72 per cent of its immigrants, compared to 56 per cent in Newfoundland & Labrador, 52 per cent in New Brunswick and just 18 per cent in Prince Edward Island. Every other Canadian province has a retention rate of 80 per cent or more.
PTs/Territories Business with Top 20 Franco Countries
| Emigration/Outmigration Estimates | Retention | Determinants of Outmigration | Tracking and Monitoring Outmigration | Impacts of Outmigration | Policy and Research Implications |
|---|---|---|---|---|---|

