Important: The GCConnex decommission will not affect GCCollab or GCWiki. Thank you and happy collaborating!
RCC userguide
What is the Regulatory Costing Calculator?
The Regulatory Costing Calculator (the Calculator) is a tool developed by the Centre of Regulatory Expertise of the Regulatory Affairs Sector at the Treasury Board of Canada Secretariat (TBS). The Calculator is a Microsoft Excel template that uses built-in formulas and functionalities from Excel 365. The user enters key information (inputs) regarding requirements of a regulatory initiative in order to estimate compliance and administrative costs imposed on stakeholders (outputs) in a manner consistent with TBS guidance and policies.
The Calculator’s purpose is to provide federal departments and agencies with a standardized tool to conduct the analysis required for the one-for-one rule (the Rule), the small business lens (SBL) and cost-benefit analysis (CBA). For the Rule, regulatory departments are to use the Calculator to quantify and monetize increases or decreases in administrative burden costs. For the SBL, the role of the calculator is to help quantify and monetize both compliance and administrative costs imposed on small business. Regulators can also use the Calculator to estimate costs of a regulation on non-business stakeholders (governments and individuals) as part of a more comprehensive cost-benefit analysis.
TBS based the Calculator’s method on the internationally recognized Standard Cost Model. The Calculator contains key data from Statistics Canada, such as the annual average consumer price index and hourly wages by National Occupation Classification. Standard default parameters are also set (such as the discount rate and number of years over which to assess impacts) to facilitate the aggregation of results across departments. As per the Treasury Board of Canada Secretariat guidance documents on the one-for-one rule and the SBL, departments are strongly encouraged to use the Regulatory Cost Calculator to monetize administrative burden costs for regulatory proposals.
Purpose of this Guide
By reviewing and referencing this guide the reader will have:
1. A basic understanding of the theory of the Standard Cost Model that underpins the Calculator.
2. Practical instructions and advice on how to use the Calculator to estimate regulatory administrative burden and compliance costs as required under the SBL and the one-for-one rule.
3. Transparency on what the calculator is doing in the background between inputs and results.
Departments and agencies should be aware that the Calculator is only a tool, and it remains the responsibility of those using it to understand and be able to explain the estimated outcomes it produces based on the various content entered.
Theoretical Foundation: The Standard Cost Model (SCM)1
1 Excerpt from SCM Network “Delivering reductions in administrative burdens: An executive summary of the SCM method”
The origins of the Standard Cost Model (SCM) come from the Netherlands, but various other jurisdictions and organizations, including the Organisation for Economic Cooperation and Development, have adopted and extensively applied it. Its main application has been in support of a number of initiatives aimed at measuring and consequently reducing the level of administrative burden costs imposed on businesses. According to the SCM Network, it is today, the most widely applied methodology for measuring administrative costs.
The basic idea of the SCM is a simple one. There are two key factors to cost, price and quantity. This simplicity in concept, however, can sometimes be more complicated to implement. Issues of when and how often an activity occurs, economic growth, accounting for time preference (discounting) and determining the most appropriate method to estimate model inputs all come into play. Addressing these issues appropriately and consistently helps to remove potential bias; this is a central goal of the Calculator’s implementation of the SCM.
As a starting point to further understanding how this is done, the main components of the SCM are described below:
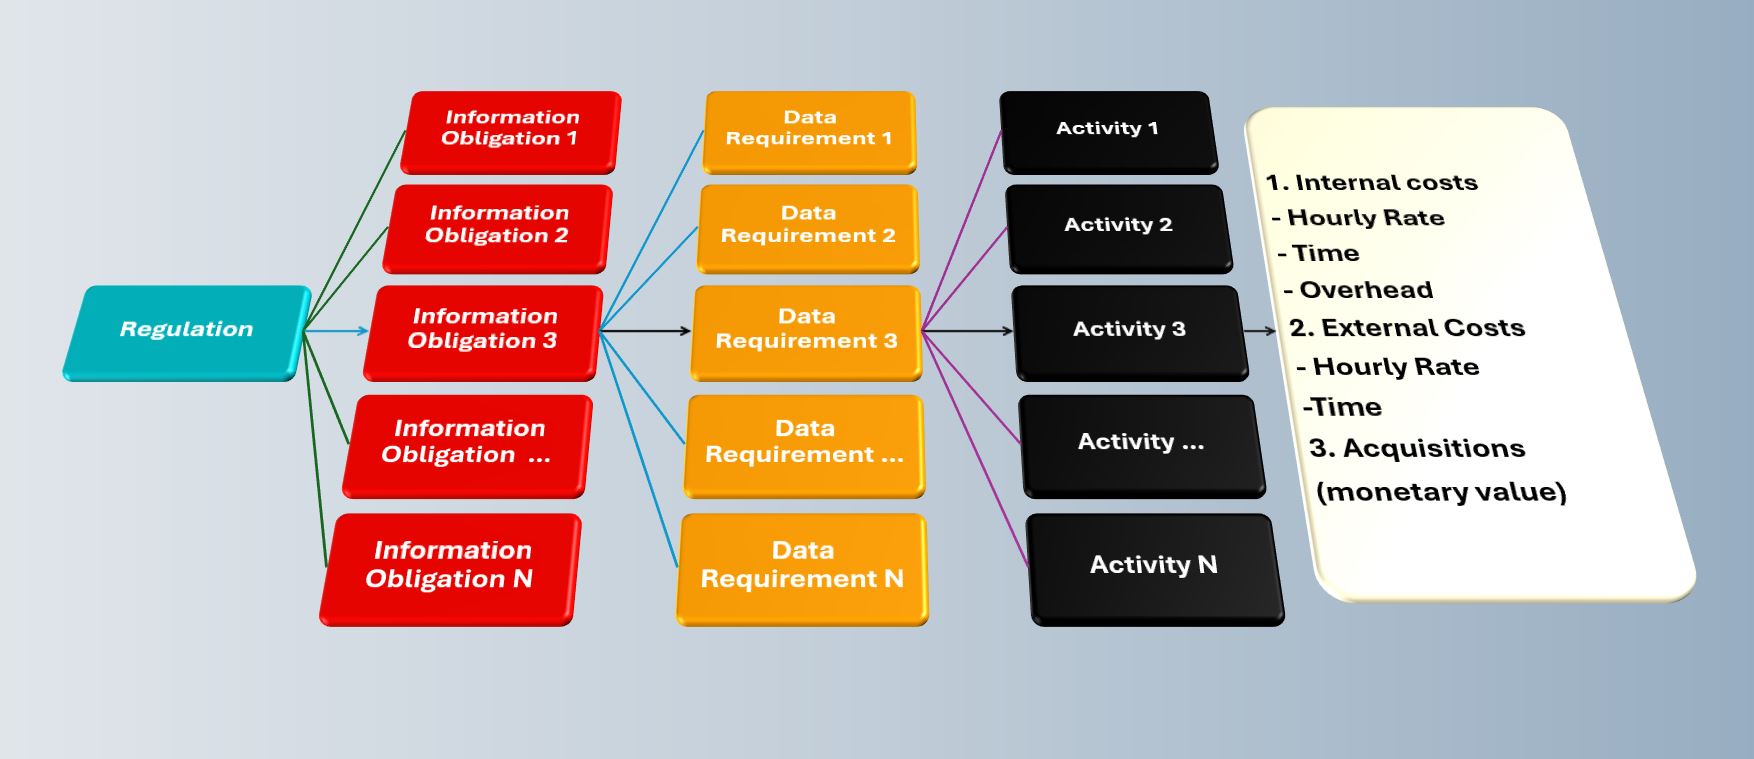
The SCM method breaks down regulation into a range of manageable components that can be measured: information obligations, data-requirements and activities.
Information obligations: Information obligations (IO) are the obligations arising from regulation to provide information and data to the public sector or third parties. An IO does not necessarily mean that information has to be transferred to the public authority or private persons, but may include a duty to have information available for inspection or supply on request. A regulation may contain many information obligations.
Data requirements: Each information obligation consists of one or more data requirements. A data requirement is each element of information that must be provided in complying with an IO.
Administrative activities: To provide the information for each data requirement a number of specific administrative activities must be undertaken (e.g. filling in information, sending information, archiving information, etc). Activities may be done internally or be outsourced (i.e. done externally).
Figure 1: Diagram of the Main Components of the Standard Cost Model
The SCM estimates the costs of completing each activity on the basis of a couple of cost parameters:
- Price: Price consists:
- Tariff or wage (hourly) costs plus overhead for administrative activities done internally or hourly cost for external service providers.
- Time, the amount of time (in hours) required to complete the administrative activity.
- Quantity: Quantity comprises:
- Population or the number of businesses and or enterprises affected.
- Frequency that the activity must be completed each year.
Combining these elements give the basic SCM formula: activity Cost = Price x Quantity = (tariff x time) x (population x frequency)
Using the Regulatory Cost Calculator
Security Issues
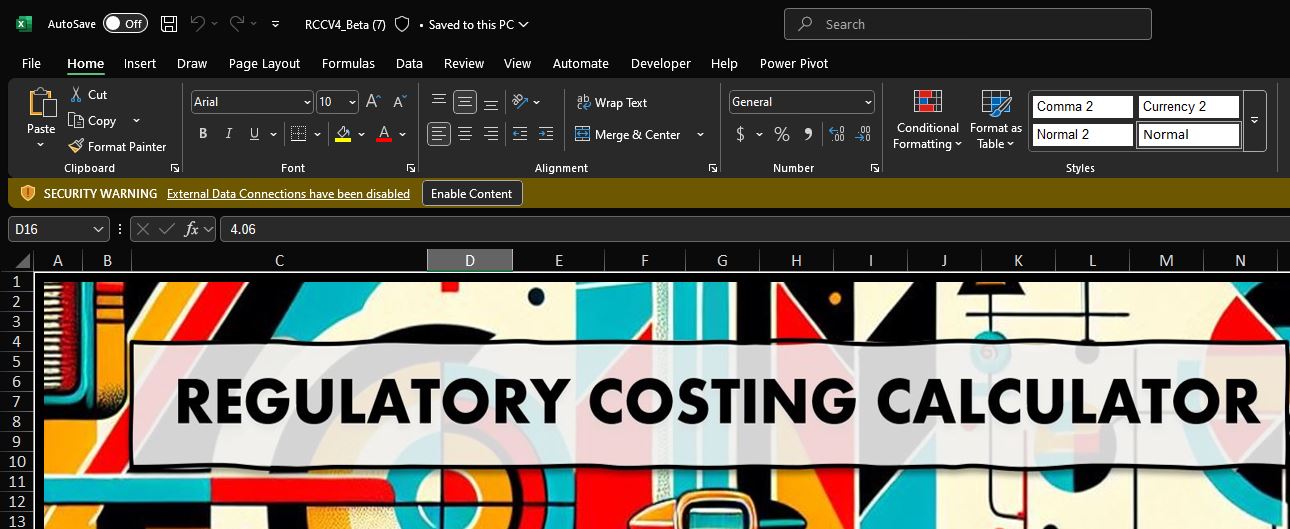
Unlike earlier iterations of the RCC, Version 4 of the Calculator does not use customized visual basic code and functions to complete calculations and automate features. This makes it easier to share the calculator regardless of the security settings of user departments or agencies. The calculator does make use of Power Query to reference a GCWiki page to check for the most recent version of the Calculator and for CPI updates. This will trigger a security warning the first time Calculator is opened and the data connections will be disabled (as shown below). Enabling content will permit the calculator to reference the GCWiki when users refresh the version and CPI queries, otherwise the calculator will function as normal, even when the data connections are disabled.
Checking for New Versions
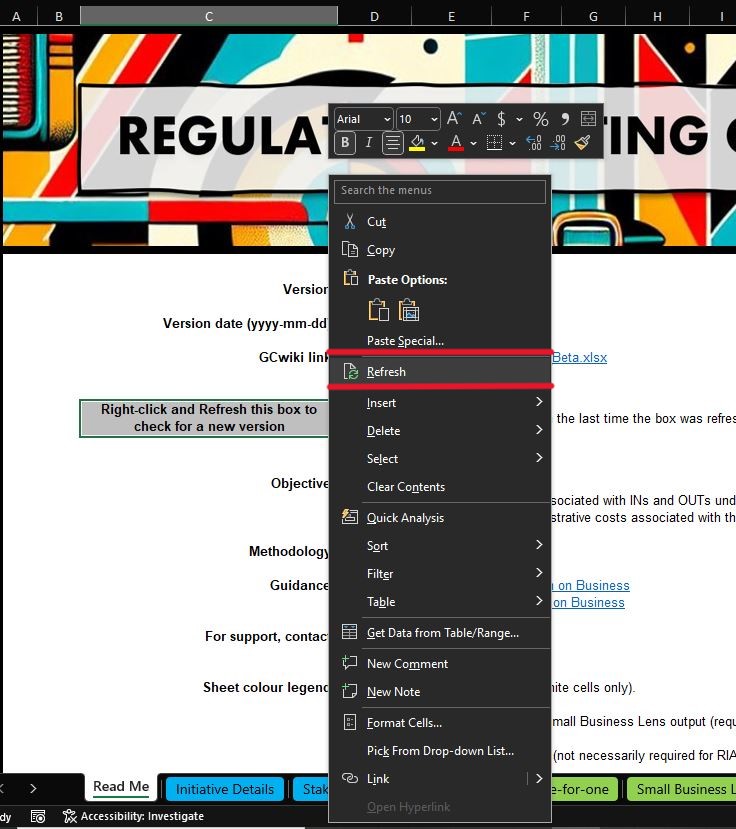
The Centre of Regulatory Expertise continuously responds to feedback from users to improve the Calculator. So, when starting a new analysis, you should check if a new version is available. You can do this by right-clicking on the “Right-click and Refresh this box to check for a new version” button located toward the top of the “Read Me” tab. Right-clicking this button open an options menu. Users should click Refresh to have the Calculator compare the upload date of the active RCC with the most recent version on the webpage. If a newer version is available, the text in cell D24 will read "A new version is available. Go get it now!". Users would then need to access the Regulatory Costing Calculator - Calculateur des coûts de la réglementation - wiki to download the new version. If a new version is not available, the text in cell D24 will read "This is the current version, based on the last time the box was refreshed."
Adjusting the Calculated Columns Excel User Setting
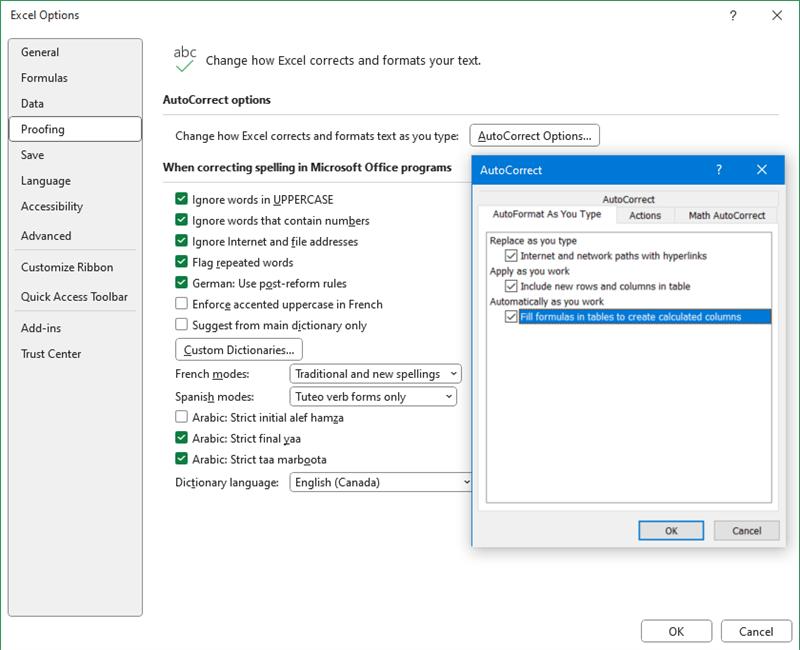
The new RCC uses tables. Sometimes it is helpful to enter an input value by using a formula directly in a cell in a table, but if a column is entirely blank, then Excel will apply a formula entered in row 1 to all other rows in that column by default. This can be annoying if you only want the formula to apply to a single row, since you will have to delete the formula in subsequent rows. This auto-filling behaviour is called "calculated columns" and the setting can be turned off in Options > Proofing > Autocorrect Options > AutoFormat as you type:
The last box should be unchecked ("Fill formulas in tables to create calculated columns).
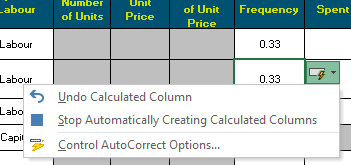
Alternatively, whenever a calculated column is created a little box will pop up in the table, and the setting can be changed there by clicking "Stop Automatically Creating Calculated Columns":
Language Selection
This version of the RCC is not configured to switch between English and French.
User Input
While the Calculator is an Excel application, a user can enter, edit, and delete almost all inputs.
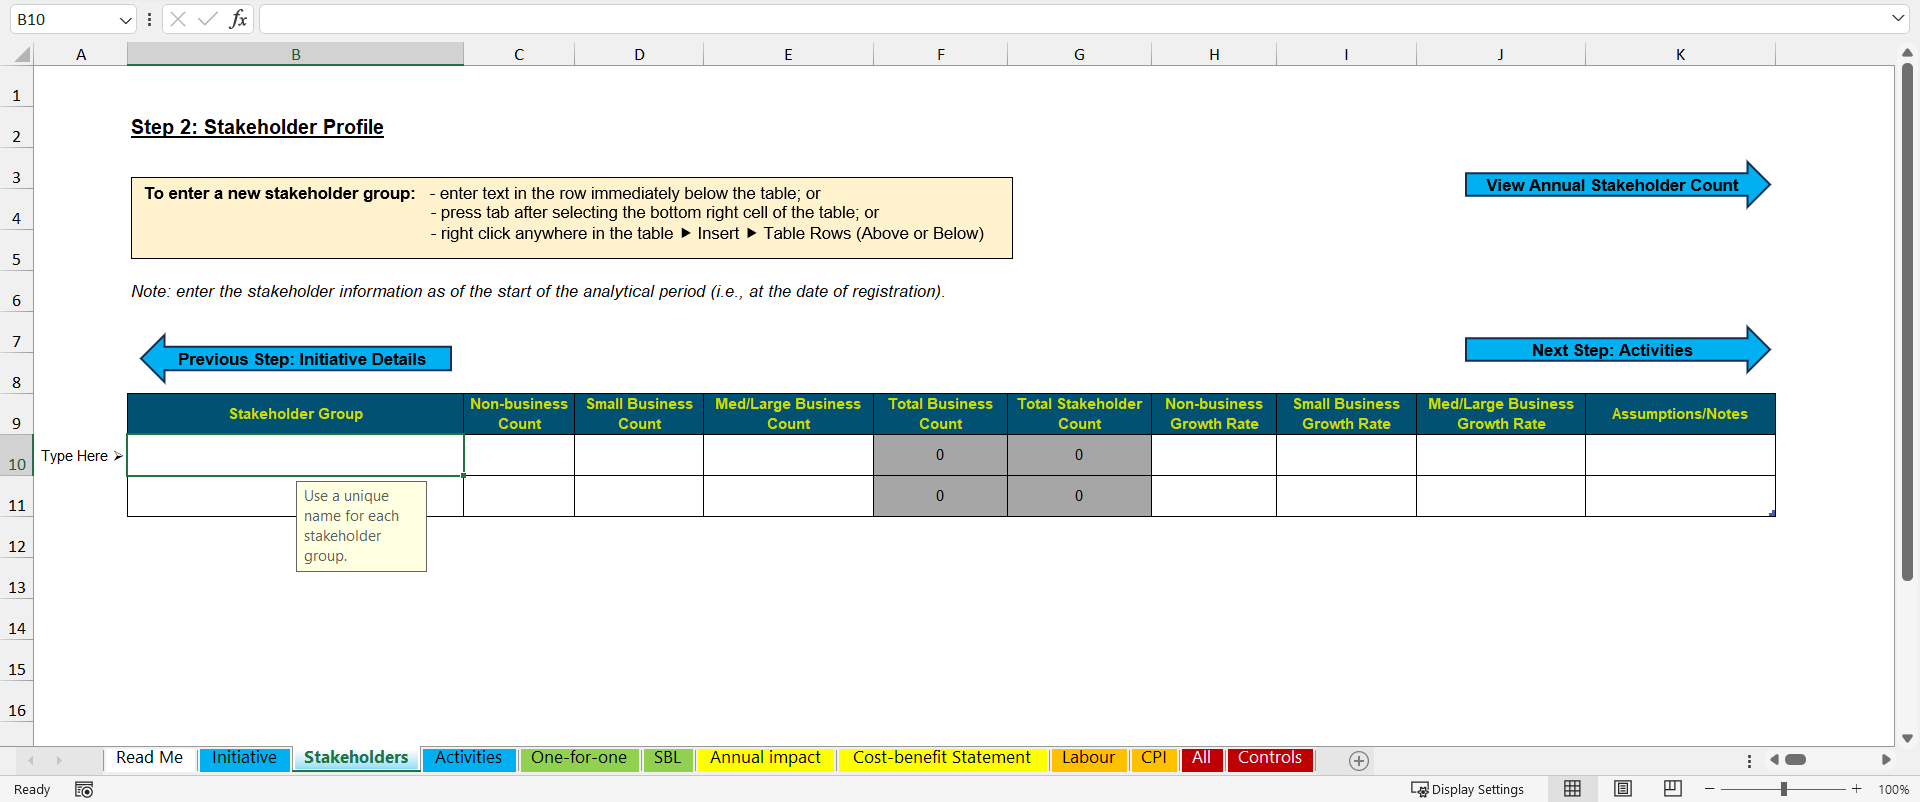
Users can enter inputs to the Calculator directly in the cells of the spreadsheet as one would do in a traditional Excel file. Cells for user input are formatted with a white, or blank, fill (see below) on worksheets with blue tabs (Initiative, Stakeholders, Activities). For tables that automatically expand as data is entered a cell with "Type Here ⮚" on the left edge of the table indicates the row where values should be inputted. Cells that are shaded grey contain formulas or pre-set parameters. Although they are not protected and the user should not change them.
Deleting Rows
Collections of inputs in the Calculator appear in rows with user input and pre-set functions. For example, the business counts and growth rates for a particular stakeholder group will be contained in a single row in the table on the Stakeholders tab, and various details of a particular activity will be contained in a single row in a table on the Activities sheet. There are two ways delete rows.
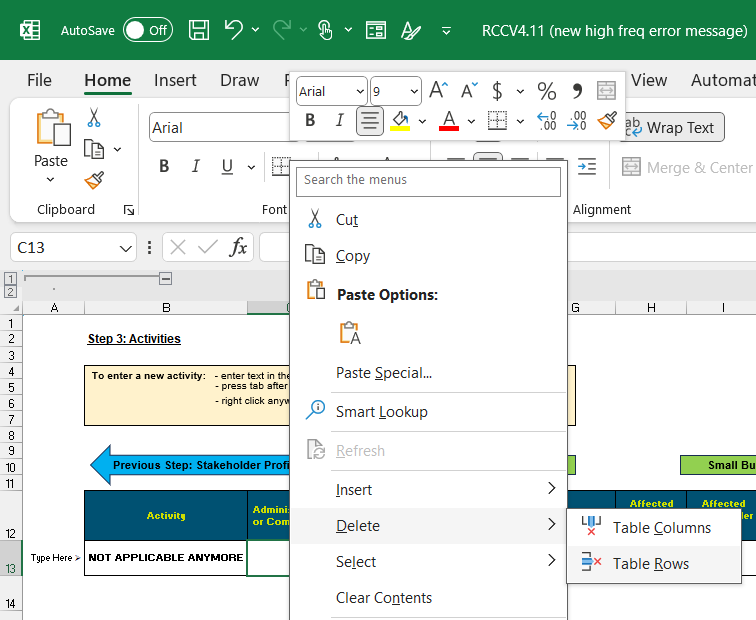
The preferred way: users can right click on any cell in the row and select Delete -> Table Row.
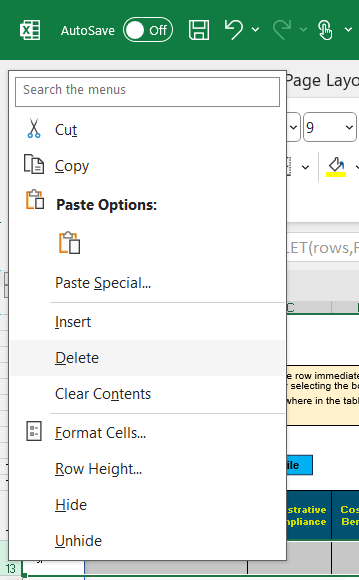
The other way: right click on the sheet's row index on the left side and delete the entire row.
It is generally better to right-click in the table and Delete table row(s) because this approach preserves any manual calculations or notes that you may have entered outside the bounds of the table.
Implementation Overview
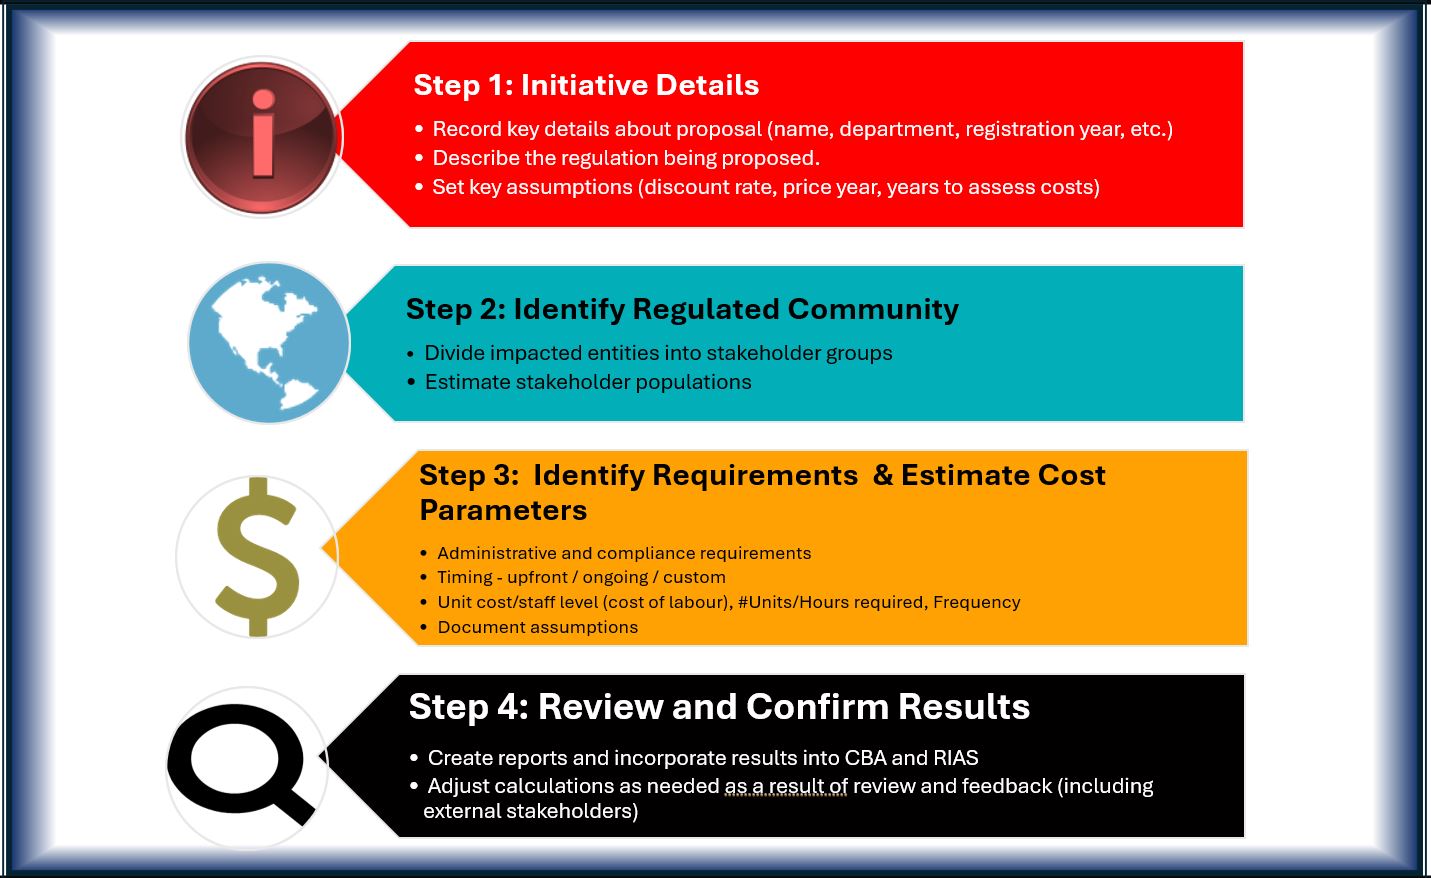
The best way to implement the Standard Cost Model with the Calculator is to follow a series of logical steps, as laid out below in the Steps to implement the Calculator image. The following sections of the guide contain further details on how to complete each of these steps and how to enter the associated information into the Calculator.
Step One: Initiative Details - Initiative Profile
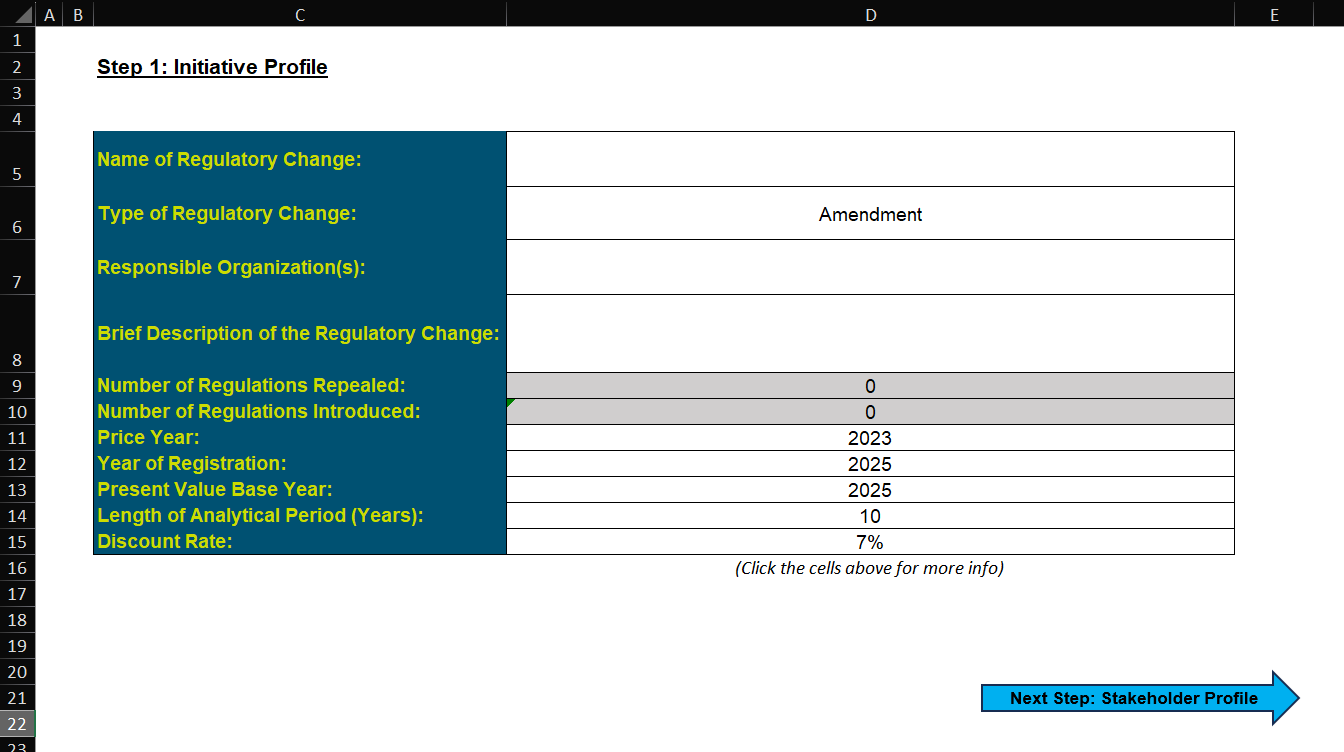
When using the Calculator, information that sets the regulatory context should be entered on the tab named Initiative.
This information is entered directly on the spreadsheet. If you wish to copy and paste from another document, it is best to click on the appropriate cell and press “F2”. The F2 key is a short-cut in Excel to edit the selected cell’s contents. By doing this you will retain formatting such as carriage returns (i.e., new lines), which if pasted directly into a spreadsheet adds content over multiple rows. If you are typing the results directly into the cell you can enter a carriage return in a cell by pressing “alt-enter”.
The first information to provide (Cell D5) is the official name of the Regulatory Change. The title the regulation will be given when published within the Canada Gazette. Since multiple proposals may have the same name (for example Amendments to the Canadian Aviation Regulations), a distinct nickname should be added in parentheses. For reference purposes it is advised that you add the Statutory Orders and Regulation number (SOR number) to this field after the regulation has been registered. The SOR number will allow cross-referencing Calculators to regulations in the future.
The Type of Regulation is a selection from a drop down list. It’s either an amendment, a new regulation, a repeal and replace or repeal multiple to replace with a new one. When a selection is made here, The Number of Regulations Repealed and the Number of Regulations Introduced cells automatically update.
Responsible Organization. This is the name of the department or agency that will recommend, make, and/or approve the regulation. When a regulation is jointly managed by several departments, this should be mentioned in the assumptions and notes area as well as any information relevant in support of the decision of which the minister is responsible.
Brief description of the regulatory change: Put in a clear and concise description so TBS analysts and future analysts can look at this and understand. The RCC does not use this information. Because the Calculator is designed to measure incremental business impacts, this description should focus on how the regulations would cause businesses to change the way they operate. For context purposes, the user may also wish to briefly describe the objectives of the regulation. Never assume that a second party, who may review the Calculator, has access to supplemental documents such as the Regulatory Impact Analysis Statement. To the extent possible, make the RCC a stand-alone product that is easy to follow. In summary, the regulatory context should briefly describe: 1.what the regulation does; 2. what is its intended outcome; and 3. how it will impact businesses.
•Number of regulations repealed. This is a drop-down list. It is only filled if the Type of Regulatory Change selected is Multiple Repeal and Replace.
•Number of Regulations Introduced. This is updated automatically when the regulatory change is selected. If the proposal is introducing more than one regulation, a separate calculator should be used for each regulation.
•Price Year. The year of prices that annual impacts are reported. Prices used to estimate impacts on the Activities are all converted to the same year on the Annual Impact tab. Prices for labour cost data in the Calculator are from 2021. If a different price year is selected the calculator will deflate or inflate these values using the Consumer Price Index to the selected price level. The price year for the one-for-one rule is determined by the Red Tape Reduction Regulations (currently 2012), it is not affected by this selection.
•Year of Registration. The year that your department anticipates the regulation will be registered. This is the Start Year of Analysis when entering periods in the the Activities Sheet.
•Present Value Base Year. The is the year that impacts are discounted back to. Typically, this is the same as the registration year, but there is an option to use something different.
•Length of Analytical Period. This is the number of years over which you will estimate impacts. TBS policy requires a minimum ten years for Cost Benefit Analysis (CBA). The Red Tape Reduction Regulations require a ten-year period for INs and OUTs under the One-for-One Rule.
•Discount Rate. The percent per year that the value of future impacts will be reduced. This value should normally be set to 7% (real discount rate), as required by TBS CBA policy and the One-for-One rule. However, other discount rates can be used. This does not affect the One-for-One Rule calculation. By default, that uses 7%.
Step Two: Identify Regulated Community – Stakeholder Profile
The next step in the process is to identify, group and estimate the number of businesses that the regulatory proposal will affect.
Unlike earlier iterations, Version 4 does not have built-in information from Statistics Canada on counts of businesses using categories from the North American Industrial Classification System (NAICS).
This information is available at: Canadian Industry Statistics - Innovation, Science and Economic Development Canada
Users need to enter stakeholder counts manually.
The enter a Stakeholder group, click inside the table to enter a new group. Each group must have a unique name otherwise results on subsequent (green and yellow) sheets may not be valid.
Counts
Non-businesses consist of any stakeholder that does not meet the definition of a business in the Red Tape Reduction Act, which defines a business as "a person or entity that engages in commercial activities in Canada, other than for a public purpose. (entreprise)". This may include private citizens, any level of government, a First Nations band, a self-governing First Nation, a school, college or university, a hospital, or charity.
Small businesses are defined based on the commonly used definitions for what is considered a “small” business in Canada, which are any business, including its affiliates, that has fewer than 100 employees or less than $5 million in annual gross revenues. This includes micro businesses, which have fewer than 5 employees or less than $30,000 in annual gross revenues.
Medium-Large Businesses are any business that does not meet the definition of a small business.
Growth Rates
To estimate regulatory impacts, you need to know how many stakeholders are in the market at any given time. The RCC takes the initial stakeholder counts from the Stakeholders tab, and applies the growth rates in every year throughout the analytical period.
Annual growth rates: At the moment there is only an option to exponential growth. Users should enter the average annual growth rate as a percentage of each stakeholder. If the growth rate is left blank, then it is assumed to be zero. In a future version you may be able to model growth in different ways, and if that sounds like something you’d like to work on, feel free to reach out to TBS CORE and offer your services!
•The number of affected businesses at any time is determined by the following formula:
Businesses in Period p = Businesses in period0 ∗ (1+growth rate)(p/frequency)
The exponent at the end of the formula just splits your annual growth rates into periodic growth rates. For example if you have a monthly requirement, it happens 12 times per year, and over 10 years you would have 120 different periods where you’d want to know the stakeholder count. This formula automates that for you, so you only need to enter the annual growth rate and the frequency of the activity.
EXAMPLE: businesses in period 0 = 100; growth rate = 1%
What is the number of businesses in period 2 if an activity’s annual frequency = 1? = 100∗ (1+0.01)(2/1)=102
What is the number of businesses in period 2 if an activity’s annual frequency = 4? =100∗ (1+0.01)(2/4)=100.5
Assumptions and Notes
As a best practice, users should record the assumptions and notes about that stakeholder group. For example, what is the source of the data for the counts and growth rates? Did you use another source to allocate the total count into the count for small businesses versus med/large businesses?
Annual Breakdown
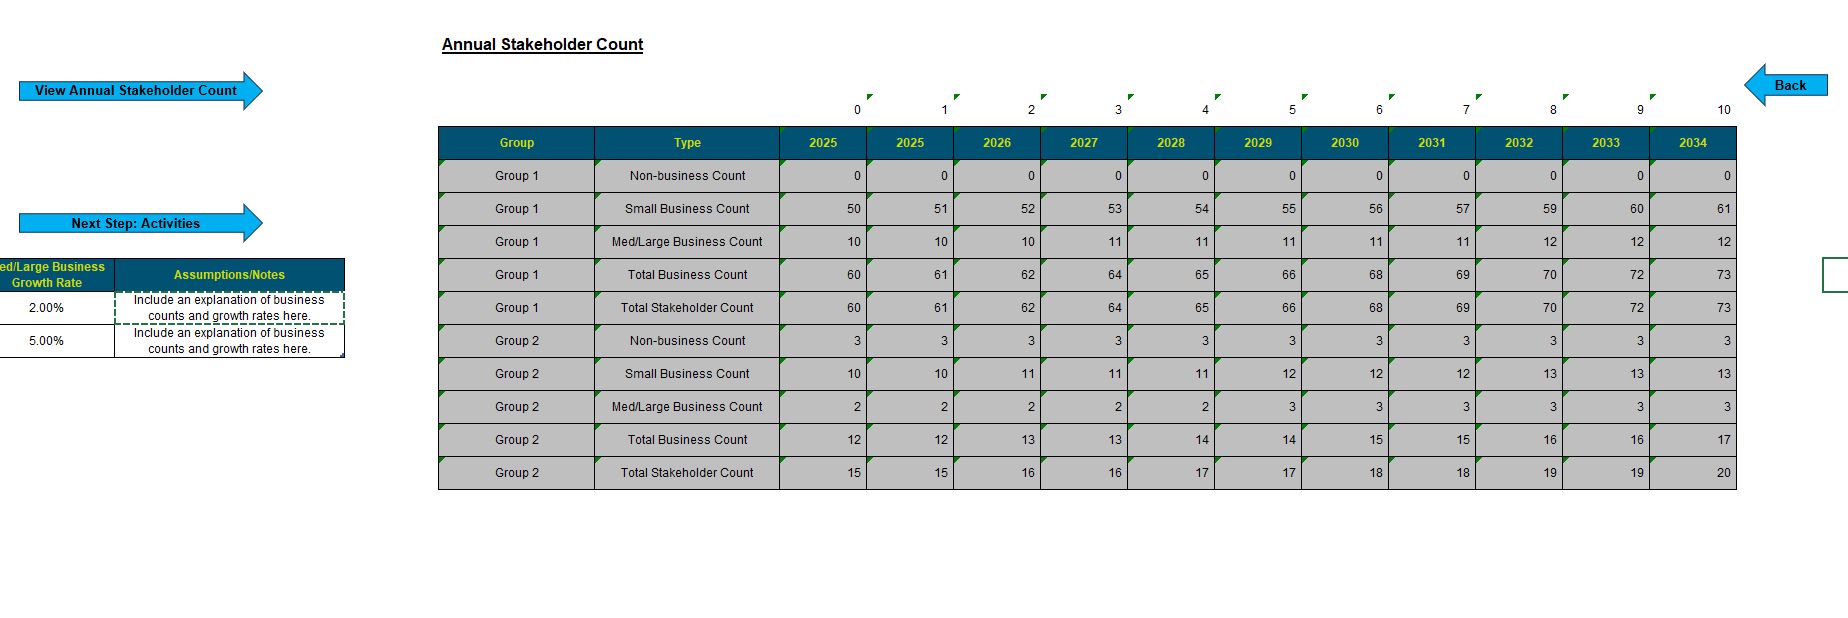
You can view the Annual Stakeholder Count which is broken down further to the right on the Stakeholders sheet, as shown in the image below. This breakdown is an output only, meaning that if you delete it / override it with different information, that will not affect the cost estimates on subsequent sheets.
It is recommended that users view the annual stakeholder count to validate that the growth rates were entered correctly. For example, if you try to enter 3% annual growth but accidentally entered 300% annual growth, the estimated stakeholder counts towards the end of the analytical period will be so high that you should realize something is wrong.
Finally, there is the navigation arrow to move to the next step or click the Activities tab.
Step Three: Identify Requirement and Estimate Impact Parameters
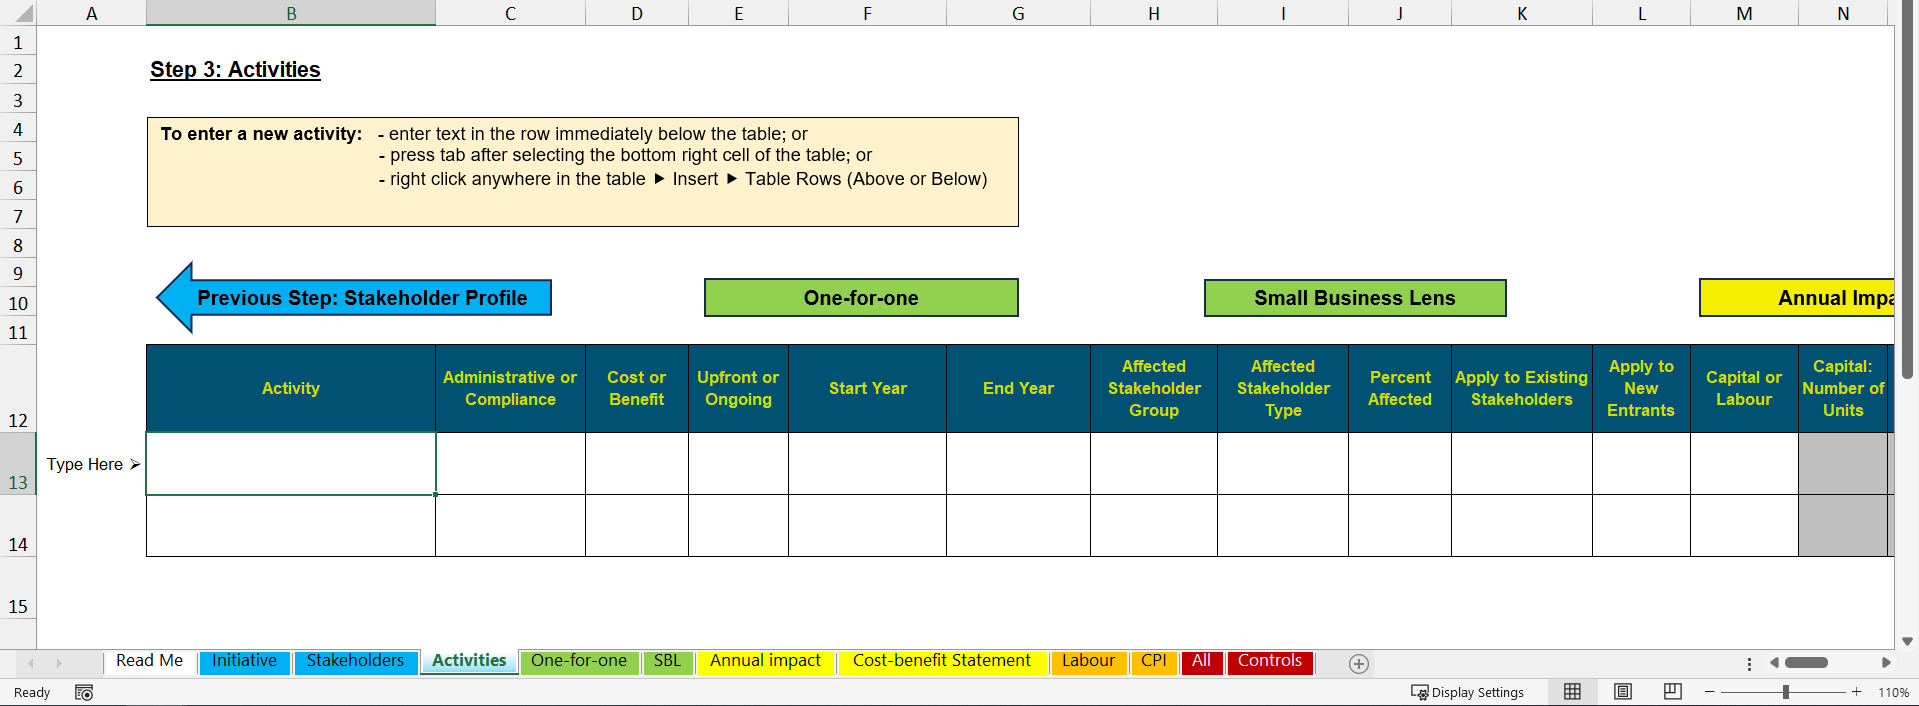
This information can be entered directly into the spreadsheet in the Activities tab.
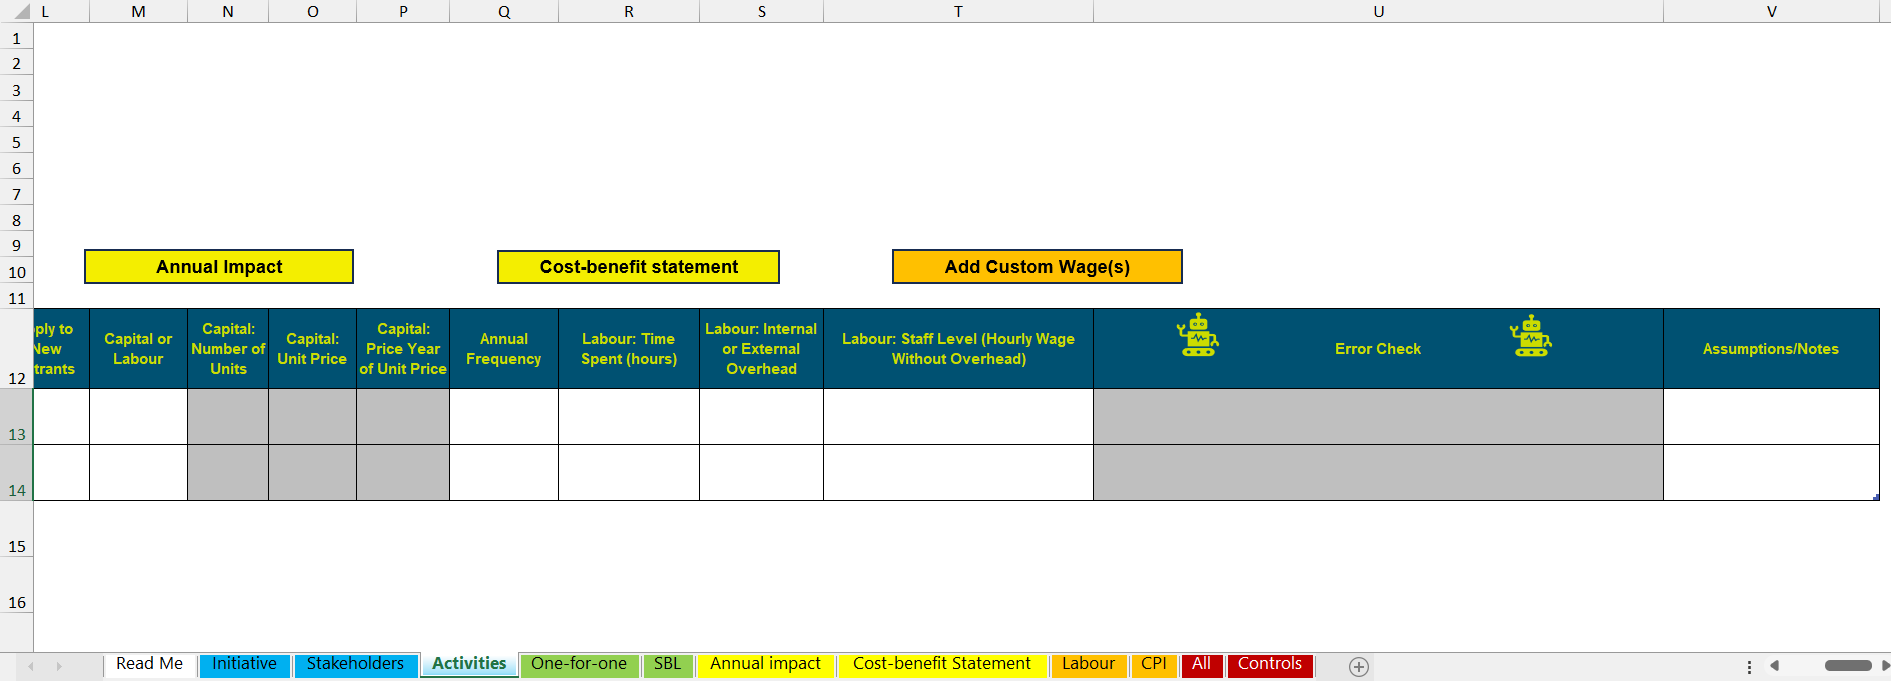
Note: feel free to adjust the zoom level, font size, and/or column widths to match your personal preferences. It is possible to adjust these things to fit all fields on your screen at once. If all of your activities will include labour, you can hide the columns related to capital inputs (M, N, O). Conversely, if you are only entering capital activities, you can hide the columns related to labour (R, S, T). The Error Check and Assumptions/Notes columns can also be hidden, but just be sure to scan for any error messages before submitting your work to TBS.
A floating message saying "Type Here ⮚" will appear on any incomplete rows. This indicates that more information is needed before moving on to enter a new activity. Feel free to hide or delete that column if you don't find it helpful.
By default, when opening the RCC there will be 2 rows in the Activities table. Additional rows can be added in 3 ways, as outlined in the yellow box in the sheet:
- Type info in the first row under the table. Once you hit enter, the table will automatically expand to include this new row.
- Go to the bottom right cell of the table (e.g., the Assumptions/Notes column in the bottom row), and press the Tab key on your keyboard. This will make the table expand to include a new row.
- Right click anywhere in the table, and select Insert > Table Rows (Above or Below).
activity:
This is a description of the activity. The description should be clear and easy to cross-reference requirements described in the Regulatory Impact Analysis Statement. The activity description will be used in the auto-generated text on the One-for-One Tab. Unlike in the Stakeholders input table where group names must be unique, the same activity name can be used on multiple rows. On the Annual Impact sheet, when the breakdown method is "By activity", multiple rows of activities with the same name will be bundled together.
Administrative or Compliance:
This involves selecting either “compliance" or "administrative" from a drop-down list.
Red Tape Reduction Act defines administrative activity for business as "anything that is necessary to demonstrate compliance with a regulation, including the collecting, processing, reporting and retaining of information and the completing of forms."
If the RCC is being used to calculate government costs, then Administrative activities would be anything necessary to record and confirm compliance, such as reviewing submitted reports and forms. Ensure that government costs are attributed to non-businesses only.
Cost or Benefit:
Most sections of the RCC use the terminology "Cost" and "Benefit". However, in the One-for-One Rule section, the language is "IN" and "OUT". An "IN" is an Administrative Cost and an "OUT" is an Administrative Benefit. If you are analyzing a regulatory initiative that removes a baseline reporting requirement, enter that as an Administrative Benefit (not a negative cost).
If the Calculator is being used for a complete cost benefit analysis, then a compliance activity is simply a cost or a benefit.
Upfront or Ongoing:
Upfront activities occur one time per affected stakeholder. The impacts are assumed to occur at the start of each period. Example: affected stakeholders must spend $100 on a piece of equipment (one time only).
Important point: although upfront costs only occur one time per affected stakeholder, that does not mean that they only appear in one year of the analysis. If there is a positive stakeholder growth rate, that means new businesses are entering the market over time, and they incur the upfront costs too. Example: if you have a 1% stakeholder growth rate then there will be new entrants every year, and there would be upfront cost appearing in every year throughout the analytical period.
Ongoing: activities can happen multiple times per stakeholder, on a recurring basis at a specific annual frequency throughout the analytical period. These impacts are assumed to occur at the end of each period. An example of an ongoing activity is stakeholders submitting a report to the government 3 times per year (and 3 times per year over 10 years means this activity would happen 30 times).
The assumption that ongoing activities occur at the end of each period may be different than your typical approach in a CBA. This assumption affects how many stakeholders incur the cost and how the cost is discounted. For example if you have an ongoing cost in Year 1, it is assumed that it is incurred at the end of the year (i.e., December 31). This means that the annual growth rate is applied to the stakeholder count from the beginning of the year, and the discount rate is applied.
Start Year
The start year for an activity can be selected from a dropdown list, which is based on the information entered in the Initiative tab. The start year must be on or after the Year of Registration. You can manually select the specific year, or choose the more general "Start of Analytical Period". A benefit of the latter approach is that if the year of registration is delayed for whatever reason, you don't have to manually update the year in the Activities input table.
End Year
The end year can be selected from a dropdown list and must be on or after the start year. The maximum possible value for the end year is determined by the Length of Analytical Period (Years) entered in the Initiative tab (but the actual value could depend on the regulatory requirement).
Unlike previous versions of the Calculator, the end year is inclusive (n.b. the start year was inclusive in earlier versions and it is still inclusive now). This means impacts are calculated from the beginning of the selected start year to the end of the selected end year. Therefore, the number of years in the Analytical Period may appear one year less than a simple subtraction might indicate. For example a Proposal that is registered in 2025 and has a Length of Analytical Period (Years) of 10 years, would have a Start Year of 2025 and End Year of 2034.
For activities occurring in a single year, the start and end year will be the same.
Affected Stakeholder Group
All Activities must have an affected stakeholder group. The affected stakeholder group must be one of the groups listed on your stakeholder profile sheet. If you select a particular stakeholder group on the Activities sheet and then modify its group name on the Stakeholders sheet, you will have to re-select the affected stakeholder group.
If the Calculator is being used to calculate impacts for government, then a Government stakeholder group should be created with a Non-Business Count equal to one.
Users can select a specific group from the dropdown list or select "All Groups." Selecting "All Groups" will apply the activity to each group entered on the Stakeholders sheet, and the impacts will be disaggregated appropriately on the yellow output sheets (when sorting impacts "By Stakeholder Group"). Alternatively, sometimes you may want to apply an activity to all stakeholders and see a distinct row for each one on the Activities tab. Having a distinct row for the same activity applied to each stakeholder group may be necessary if different stakeholders would incur different impacts to conduct the activity (e.g., the different groups may have different baseline compliance rates).
Affected Stakeholder Type
The stakeholder type, specifying whether it applies to businesses, non-businesses, small businesses, or large businesses.
Percent Affected
Percent affected applies to the number of businesses impacted per year. If, for instance, a stakeholder group consists of 100 businesses, but only half of them are affected per year, the percentage affected in this case would be 50%.
Apply to Existing Stakeholders
This is a "Yes" or "No" option.
Selecting "Yes" means that the number of stakeholders affected in each period will be the percentage affected of the existing population of that stakeholder group.
Selecting "No" means that the number of stakeholders affected in each period will only be the percentage affected of the New Entrants, based on the growth rate specified in the Stakeholder Profile Tab.
Selecting "No" in this column and the Apply to New Entrants column will produce an error indicating that: This activity does not apply to anyone. This activity does not result in any incremental impact.
Apply to New Entrants
This is a "Yes" or "No" option.
Selecting "Yes" means that new stakeholders will be included the number of affected stakeholders for that group in each period.
Selecting "No" means that only the stakeholders at the beginning of the period of analysis would considered affected in each period.
Selecting "No" in this column and the Apply to Existing Stakeholders column will produce an error indicating that: This activity does not apply to anyone. This activity does not result in any incremental impact.
Combinations of Apply to Existing Stakeholders and Apply to New Entrants
| Apply to Existing Stakeholders | Apply to New Entrants | Effect |
|---|---|---|
| Yes | Yes | Assuming that a growth rate was indicated, this activity with this combination with apply to the total population of the selected Stakeholder Group in that period. |
| Yes | No | This activity would only apply to the population of the selected stakeholder group at the beginning of the period of analysis, regardless of what growth rate is indicated. |
| No | Yes | This activity would only apply only to the population of the new stakeholders in the selected stakeholder group in the indicated period. |
| No | No | This will produce an error indicating that: This activity does not apply to anyone. This activity does not result in any incremental impact. |
Capital or Labour
Indicate if the resource required is capital or labour.
Capital should be chosen when equipment or durable goods would be purchased (In / cost) or avoided (Out / benefit).
Labour should be selected when a task requires an individual to spend time to complete it.
An activity may require both capital and labour. Unfortunately labour and capital can not be entered on the same row. The same activity name can be used to enter those impacts on different rows.
Capital: Number of Units
This is the number of units that the one stakeholder would be expected to purchase at one instance. If the Annual Frequency is greater than 1 then the number of units is not the same as the number of units per year. For example when the Number of Units is 5 and the annual frequency is 6, then the total number of unit per year is 30 (i.e., 5 units will be purchased on 6 separate occasions).
Capital: Unit Price
This is the price of one unit.
Capital: Price Year of Unit Price
On the Initiative tab you entered the Price Year to be used in the analysis, which is an important aspect of the units of measurement. If the unit price info was pulled from an older document, then the price may not align with the Price Year on the Initiative tab. This is normal, but you just need to specify the price year for the unit price information. The RCC will then automatically convert this value to 2012 prices for the one-for-one rule (if applicable), and to the price year selected on the Initiative sheet everywhere else.
Annual Frequency
For each regulatory activity, the frequency determines how many periods there are in each year in the analysis. The number of periods per year can affect the undiscounted impact estimates because this determines how often the RCC estimates the stakeholder count, and undiscounted impacts depend on how many stakeholders are in the market at any given time. The number of periods per year can also affect the discounted impact estimates because each subsequent period happens later in the analytical timeframe and is therefore discounted to a greater extent.
The regulatory text may explicitly state how often stakeholders must conduct a regulatory activity (e.g., "do activity X once per year" or "do activity X every 6 months"). Other times, the regulatory text may state that an activity must be conducted every time some other event happens (e.g., "do activity X every time Event Y happens"). An example of the latter is a requirement to report the importation of goods containing a certain chemical: this could happen 1 time, 2 times, or 1,200 times per year.
Frequencies in the RCC can be grouped into three categories:
- frequency = 1
- frequency > 1
- frequency < 1
Frequency = 1
If the frequency is set to 1 then the RCC will more closely align with how you have probably set up your main CBA (e.g., 10 years of impact estimates spread over 10 columns). However, recall from above that upfront impacts are assumed to be incurred at the beginning of every period and they are always assumed to have a frequency of 1. Upfront activities start at period 0, so if an upfront activity spans 10 years it will have 11 total periods (starting at period 0 and ending at period 10). Conversely, ongoing impacts are assumed to be incurred at the end of every period. Ongoing activities start at period 1, so if an ongoing activity spans 10 years it will have 10 total periods (starting at period 1 and ending at period 10). The way the RCC treats upfront vs. ongoing activities may partially explain some numerical differences between your RCC and your CBA, even if both use an annual frequency of 1.
Frequency > 1
You may decide to use a frequency greater than 1 for an ongoing activity if the regulatory requirement explicitly states that it must be conducted several times per year, or if the requirement to conduct the activity is triggered by some other event that happens several times per year. A frequency greater than 1 will split each year of the analysis into evenly spaced periods corresponding to the frequency. For example, if the frequency = 2, then each year will have 2 periods and there will be 20 total periods over a 10-year timeframe. If the frequency = 1,200, then each year will have 1,200 periods and there will be 12,000 periods over a 10-year timeframe.
Since the RCC estimates the stakeholder count in every period, then an annual frequency of 1,200 means that it will estimate the stakeholder count 1,200 times per year (which is more than 3 times per day!). This level of precision may not be warranted based on the historical data you are using to justify your annual stakeholder growth rate. Also, if you are doing the RCC in parallel with a separate CBA spreadsheet, you have probably not set up your main CBA to have 1,200 distinct periods per year, so using a very high frequency may increase the differences between your RCC and CBA results. Although there is nothing mathematically wrong with using a high frequency in the RCC, it can be computationally intensive and it may not be necessary.
If we consider an example where an activity takes 1 hour per occurrence, there are several ways to model it if it happens 1,200 times per year:
- Frequency = 1,200; Time spent per occurrence = 1 hour
- Frequency = 1; Time spent per occurrence = 1,200 hours
- Frequency = 12; Time spent per occurrence = 100 hours
- Frequency = 4; Time spent per occurrence = 300 hours
All of the above methods will result in 1,200 hours being spent on the activity per year for businesses that are in the market at the start of each year. However, since the frequency determines the number of periods, it also determines at which point new entrants will enter the market and therefore begin to incur the cost. Stakeholders who enter the market partway through the year would not incur the cost as many times as those who were already there at the start of the year. With frequency = 1, all new entrants are assumed to join the market and incur the ongoing cost at the end of the year, meaning that all new entrants would spend 1,200 hours on the activity. This implies that the undiscounted impacts can be different depending on the selected frequency (whenever the stakeholder growth rate is not zero).
Furthermore, with 1,200 periods per year, every subsequent period will be discounted to a slightly greater extent to bring it back to the present-value base year. Compared to using a frequency of 1 and a time spent per occurrence of 1,200 hours, using a frequency of 1,200 and a time spent per occurrence of 1 hour will result in slightly higher discounted impacts. This is because with high frequencies, impacts are assumed to be incurred earlier in the year and are therefore discounted to a lesser extent. In summary, different methods of modelling the activity by shifting between frequency and time spent will not give the exact same results. Use your judgement to determine the best way to model each activity.
Note that the Error Check column will generate a warning message if you enter a frequency greater than 12. Review the message and consider how else you might be able to model the activity. Consult your TBS analyst if you are unsure what to do.
Frequency < 1
Regulatory requirements sometimes state that the activity must be conducted less than once per year, or the activity may be contingent on an event that happens less than once per year. In these situations you may decide to use a frequency less than 1.
The way the RCC estimates impacts with frequency less than 1 depends on the stakeholder growth rate: whether it is negative, zero, or positive. But regardless of the stakeholder growth rate, the Start Year selected in the table on the Activities sheet will be the first year in which the impact occurs (note this is different compared to how previous versions of the RCC worked).
First let's imagine that the stakeholder growth rate is zero. After the Start Year, there will be a gap with several years of $0 impacts. The number of years with $0 impacts before the next occurrence depends on the frequency: there will be 'n' years of $0 impacts for frequency = "1/n". Since the growth rate is zero, the number of stakeholders conducting the activity every 'n' years will be constant.
Next imagine that the stakeholder growth rate is negative. This case is similar to the situation where the growth rate is zero, except for the fact that the number of stakeholders who incur the cost every 'n' years will decline over time. Since ongoing impacts are assumed to be incurred at the end of every period, this means that the first decline in the stakeholder count happens in period 1. In other words, if you enter 100 stakeholders on the Stakeholders sheet, but the growth rate is negative, then fewer than 100 of them will incur the ongoing cost in year 1.
Lastly, consider the case where the frequency is less than 1 but the stakeholder growth rate is positive. This case is a bit more complicated because every year bring some new entrants (new 'cohorts'), and each cohort of new entrants will be on its own track of incurring the impact every 'n' years for frequency = '1/n'.
Note that with positive stakeholder growth and a frequency less than 1, there are no years with $0 impacts. In the 'off-years' there are still impact estimates because new entrants are entering the market and incurring the impact for the first time, after which they are then on their own unique track to incur costs every 'n' years for frequency = 1/n. In some years multiple cohorts will incur costs at the same time. For example, if the frequency = 1/3 and the activity starts immediately, then the existing stakeholders will incur the cost at the end of Year 1 along with the new entrants from Year 1. This is the 'first cohort' incurring the cost. The new entrants in year 2 will be the only ones incurring the cost in Year 2, and the new entrants in Year 3 will be the only ones incurring the cost in Year 3. In year 4, the first cohort incurs the cost again (since 3 years have elapsed since the last time they incurred the cost), and they will do so along with the new entrants in Year 4. In year 5 the new entrants from year 2 along with the new entrants from year 5 will incur the cost. Skipping ahead to Year 10, the following cohorts will incur costs at the same time: 1, 4, 7, 10.
The lowest frequency that should be entered is 1 divided by the total length of the analytical period (e.g., 1/10 for a 10-year analytical period). Any frequency lower than this will be equivalent to a frequency of 1 divided by the length of the analytical period, since the first cohort will not incur the cost a second time within the analytical period, and in all years after year 1, the same new entrants will incur the cost.
Labour: Time Spent (hours)
The value in this cell determines how much time will be spent for each instance that the activity is conducted. This value has to be entered in hours, but feel free to use a formula in the cell to divide any number of minutes by 60.
Labour: Internal or External Overhead
If a regulated business must pay staff to perform a new activity as a result of a regulatory change, then the total cost per hour is more than just the hourly wage: there is also an overhead rate. The overhead rate simply inflates the wage by 25% for an internal staff member or 50% for an external staff member (e.g., if a third-party firm is hired to perform the activity). The overhead rate is a proxy for things like benefits, vacation, sick leave, building rental, utilities, supplies, etc.
If you don't want to add any overhead then just leave this column blank (for example if you want to enter a custom wage that already includes overhead, or if overhead is not applicable for some reason).
Labour: Staff Level (hourly wage without overhead)
This cell contains a drop-down menu in which you can select the type of employee who will conduct each regulatory activity. The drop-down menu is supplied by a table on the Labour sheet, which by default contains 52 employee types based on Statistics Canada data.
Custom wages can be added by adding new rows to the table on the Labour sheet, or by simply typing in the wage directly into the Labour: Staff Level (Hourly Wage Without Overhead) column on the Activities table. If you enter a custom wage directly in the table on the Activities sheet then just enter the numerical value only (i.e., don't add a description here).
If you enter a custom wage on the Labour sheet you must specify the price year for the wage (e.g., did you get it from a report from 2019?), but if you enter it directly in the Activities table then it is assumed that you've entered it in the price year matching what was selected on the Initiative tab. So if your price year on the Initiative tab is 2024, make sure you enter the custom wage in 2024 prices.
Error check
The Error Check column contains a formula that checks for common mistakes and gives you a written explanation of how you could/should fix them. It is simply a series of IF statements joined by the "&" operator. If you accidentally delete this formula then the error check functionality will no longer work. You can resolve this problem by re-downloading the RCC or typing the following formula in the error check column (or a new column entirely if you've deleted the whole thing): "=ErrorCheck".
Orange-shaded error messages indicate that you may want to change something, but you don't necessarily have to. For instance, you will notice an orange error message if you enter a series of inputs that do not result in any incremental impact, since this may be something that you intended to do for completeness or transparency purposes, or maybe it was a mistake. If you manually enter a custom wage directly in the activities table, an orange message will remind you to ensure that the wage you entered is in the same price year as the one specified on the Initiative tab.. If you've used a high frequency, an orange message will suggest that you consider modelling it a different way (see the explanation of frequency above).
All other error messages will be shaded in red, indicating that something is wrong and should be resolved before you submit the RCC to TBS. Try to implement the suggested solution before reaching out for further assistance.
There is a cell on each output sheet (One-for-one, SBL, Annual Impact, Cost-benefit Statement) that checks for any red error messages. This could be helpful if you've hidden the Error Check column. If a red error is detected, the following message will appear:
Assumptions/Notes
Be sure to add any assumptions and/or notes that would justify the values you enter for the various input parameters. This will help your future self, your colleagues, and your TBS analyst. An RCC submitted to TBS without notes will delay approvals, since your analyst will have to ask you for an explanation of your assumptions.
Step 4: Review and Confirm Results
Results are shown on the One-for-One, Small Business Lens, Annual Impacts, and CBA Statement Tabs. Do not blindly accept that the RCC has produced the intended result. Check the values on these tabs to make sure that your inputs have been interpreted properly.
One-for-one
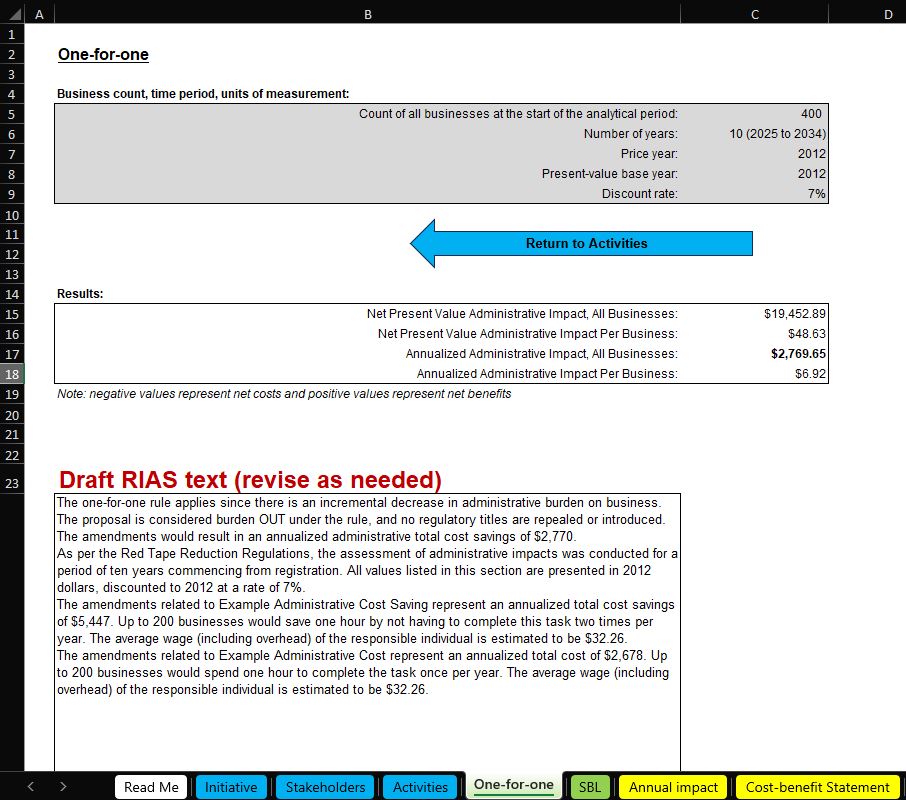
This is where users get informations to complete the One-for-One Rule section of the RIAS. In addition to the numerical values, this version of the RCC also automatically generates draft text that you can put directly in the RIAS. The extent of the modifications that will be needed will vary according to file complexity and personal preferences (of yourself and of your TBS analyst), but this should get you most of the way there.
At the top of the One-for-One tab, the grey-shaded block contains the analytical parameters for the results on this sheet. These are not input variables. According to the Red Tape Reduction Regulations values in the One-for-One section must be reported in 2012 dollars, discounted to 2012 using a rate of 7% and considered over a period of 10 years from registration.
The Results box shows the Net Present Value of Administrative Impacts on All Business, and on a per business basis. The per business calculation is based on the total number of businesses entered into the Stakeholder Table on the Stakeholders tab. The per business result is an imprecise calculation and should be used with discretion. The Annualized Administrative Impact, All Businesses value is what is reported in the one-for-one rule section of the RIAS. A positive value represents a cost savings, a negative value represents a cost.
The Draft RIAS text box is suggested text that may be used in the RIAS. It is generated using a simple if / then algorithm. This text should be considered a starting point. It would need to be proofread and adjusted to ensure it is accurately reflecting the intent of what was entered in the activities sheet.
Text is generated for each unique activity listed in the activity Table. When activities are given the same name, they are grouped together as costs or benefits. So, the annualized total costs and cost savings are reported separately if the same name is used for an activity with costs and benefits. The RIAS text reports the maximum number of businesses impacted be that activity in any one year, hence the text 'Up to 200 businesses would . . . " in the example.
The text converts the numerical hours and frequency to text and rounds to the nearest whole unit, this can result in incorrect values reported in the text. Attention should be paid to these values if irregular values are used in the calculator.
The wage reported in the text is converted to 2012 dollars and includes the overhead amount indicated in the activity sheet. When multiple activities are entered with the same name, the average wage, weighted by hours or each activityis reported.
Below the RIAS text box is the Annual Breakdown.
The Annual Breakdown tables show the costs and benefits related to the activities considered within the scope of the One-for-One Rule. Regardless of the Length of Analytical Period (Years) entered into the Initiative tab, the annual break on the One-for-One tab will only show 10 years from the Year of Registration. The only impacts included on these tables are those that are categorized as administrative include impacts on at least one business.
Tables are divided in the IN (costs), OUT (benefits, or costs savings), and NET (benefits minus costs).
The aid with error-checking, value are first presented undiscounted using the Price Year of analysis indicated on the Initiative tab. Then it is presented discounted to the same price year and present value base year at indicated on the Initiative tab. These values would match those used in the CBA. Then the values are presented undiscounted in 2012 price year and finally discounted to 2012 is 2012 prices. These values are reported in the One-for-One Section of the RIAS.
Small Business Lens
As mentioned above, you don't have to use the RCC to do your SBL section, and due to the complexity of what you're tying to model it may not be possible. But if you do want to use the RCC for this, the SBL sheet has all the tables from the RIAS template.
The grey-shaded block at the top of the sheet if for your information only. These are not input variables so modifying them here will not affect the output tables.
With the blue-shaded section at the top you can modify the order of magnitude (single dollars, millions of dollars, billions of dollars), and the way you want the tables to be sorted.
Changing the order of magnitude may be helpful if you are trying to fit big numbers into tables in Word. With the order of magnitude set to millions or billions, you may want to adjust the number of decimals. Do this in the ribbon:
The sorting methods are:
- Default: activities will appear in the order in which they are entered on the Activities sheet
- Total Impact (↑): ascending order according to the total impact estimates (smallest first)
- Total Impact (↓): descending order according to the total impact estimates (biggest first)
- Administrative then Compliance
- Compliance then Administrative
- activity (↑az): ascending order according to the name of each activity (a first)
- activity (↓za): descending order according to the name of each activity (z first)
Annual Impact
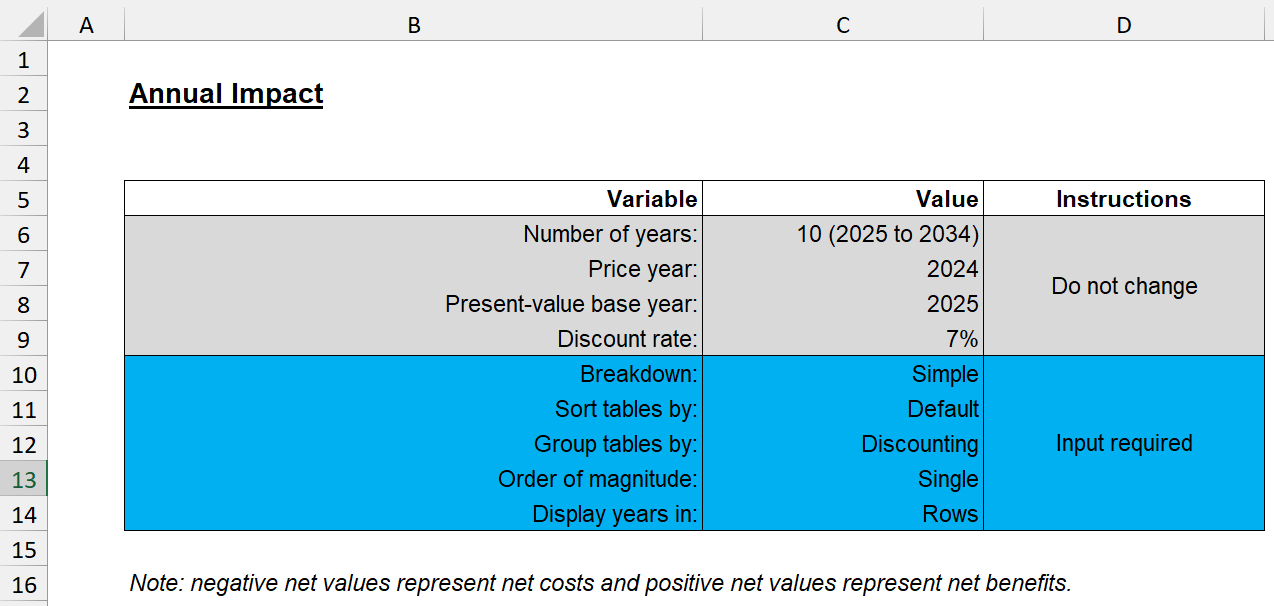
The Annual Impact sheet provides a breakdown of the discounted and undiscounted costs, benefits, and net impacts for every year in the analytical period.
At the top of this sheet, the grey block at the top is for display purposes only (these are not switches that will update the values below). The blue block contains the options that you can change.
Breakdown: this allows you to select whether you want a simple breakdown (costs, benefits, net), or a breakdown by activity, by stakeholder, or by activity and stakeholder.
Sort tables by: this allows you to sort the values in the tables in different ways. When the breakdown is set to simple, the only sorting option is "Default." But if the breakdown is anything else, you can sort by the magnitude of the impact, by the activity name, or by the stakeholder group name, as applicable. In general, "Default" sorting aligns with the order in which activities and Stakeholders were entered on their respective sheets.
Group tables by: by default this is set to "Discounting", meaning that it will first produce the Discounted Costs, Discounted Benefits and Discounted Net Impacts, then the Undiscounted Costs, Undiscounted Benefits, and Undiscounted Net Impacts. Changing this to "Costs | Benefits | Net" means that the output will look like: Discounted Costs, Undiscounted Costs, then Discounted Benefits, Undiscounted Benefits, then Discounted Net, Undiscounted Net.
Order of magnitude: this lets you change from single dollars, to millions of dollars or billions of dollars.
Display years in: by default this is set to Rows, but you can change it to Columns if you'd prefer.
Cost-benefit statement
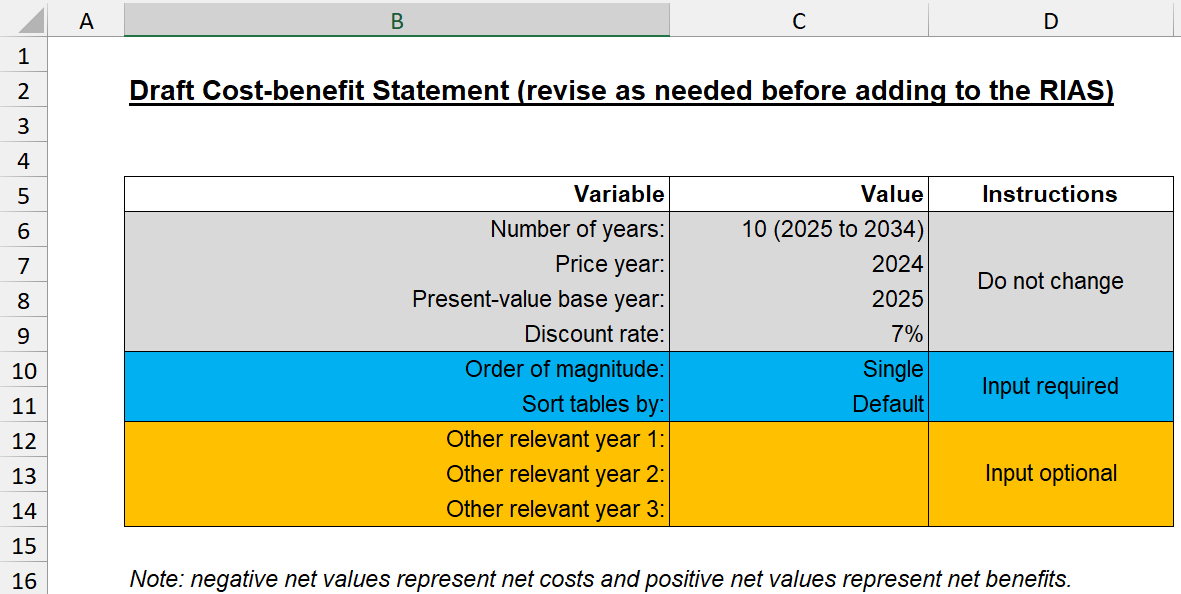
Like in the Annual Impact sheet, the grey block of values is for your information only. The results will not update if you change these values.
The blue block is not as large as in the Annual Impact sheet because the Cost-benefit statement in the RIAS template must follow a particular format (e.g., it always must be broken down by activity and stakeholder, the years are always displayed across the columns, and the annual impacts are undiscounted with only the total column being discounted).
There is also an orange block in which you can select other relevant years. By default no additional years are entered here, so the cost-benefit statement will only show the base year (year of registration) and the final year (year of registration + time period - 1). Selecting other relevant years will add them to the tables below.
Labour
This sheet contains a list of employee classifications and their corresponding hourly wages. The source data from this list is from year 2021, but this is automatically inflated to the price year selected on the Initiative tab, so you don't really have to worry about that. If you enter a custom hourly wage at the bottom of the list, then you will have to specify the price year for the hourly wage you've entered. For example, if you found a report from 2019 that contains the hourly wage for an employee at a business that is affected by the regulation you're analyzing, you would select 2019 as the price year for the wage (just like how 2021 is specified for the wages from the Statistics Canada data).
Once you enter a custom wage on this sheet, it will appear on the drop-down menu for Labour: Staff Level (Hourly Wage without Overhead) on the Activities sheet. As mentioned above, you can also just enter custom hourly wages directly into the Activities sheet, in which case you don't have to enter anything on the Labour sheet.
CPI
This is the Consumer Price Index table from Statistics Canada, which is used in the RCC to deflate impact estimates to 2012 for the one-for-one section, and to inflate all other estimates to the price year specified on the Initiative tab.
There are several different forms of the Consumer Price Index, but the one used in the RCC is the annual average price level for All Goods. Because this is the annual average price level, it is only updated once the full year has elapsed, so the latest available value is always a year behind the current calendar year.
This table is updated once per year, usually mid-January. A new RCC will likely be updated every January to account for this update, but if you want to update an RCC you're working on the second the data becomes available, feel free to add a new row with the new price level yourself.
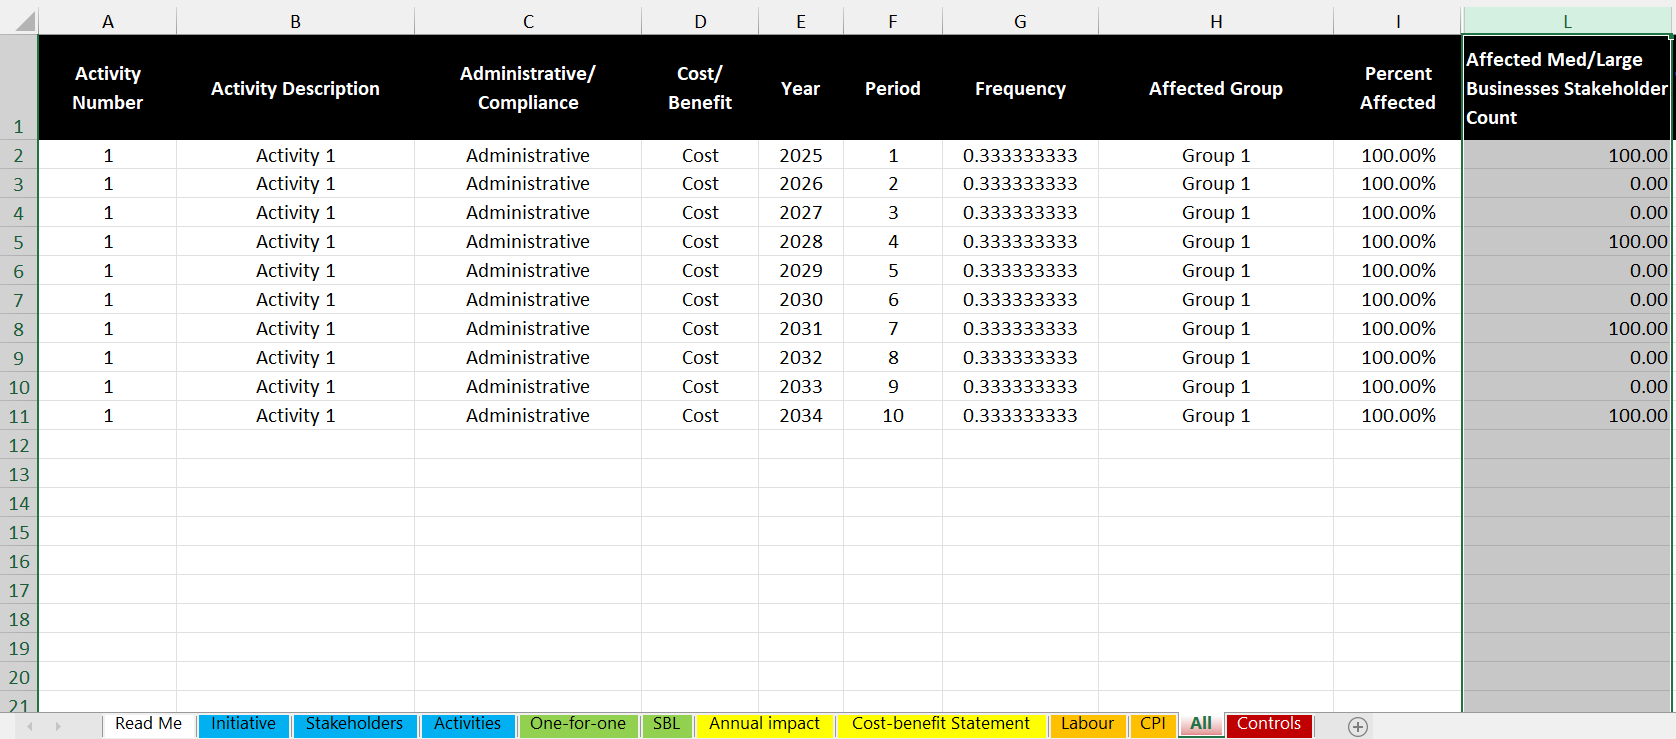
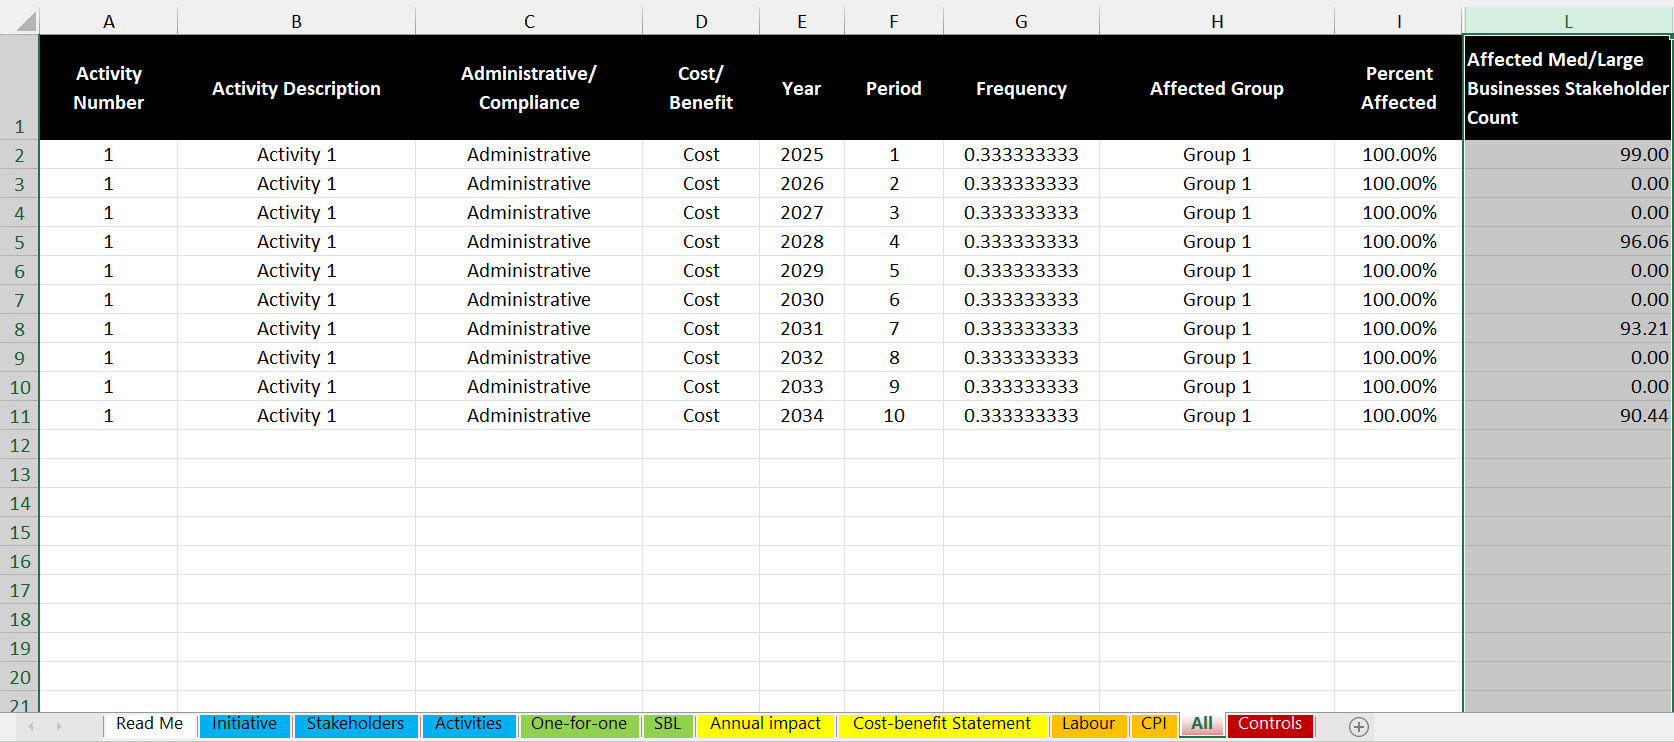
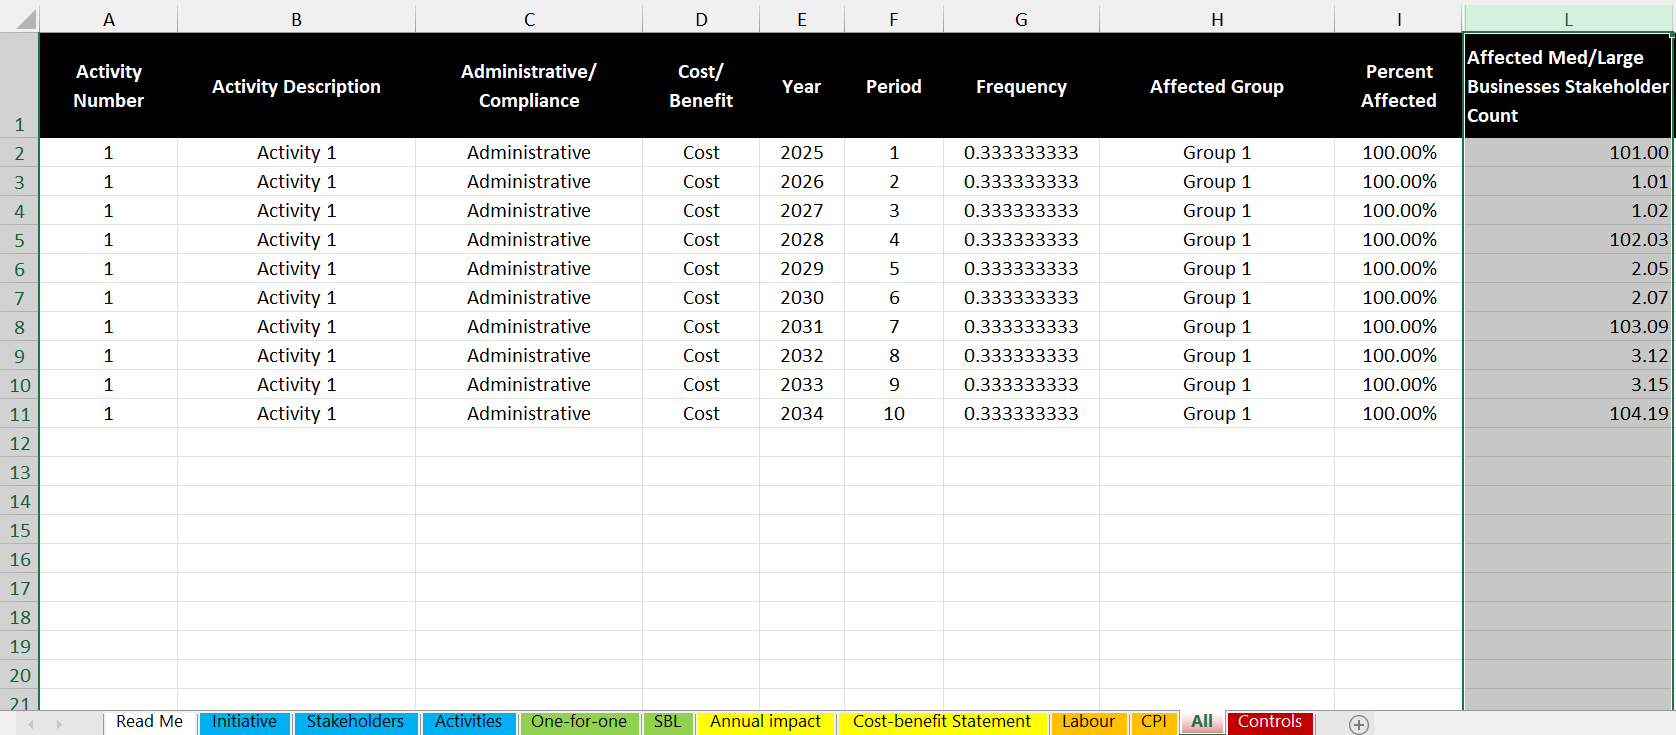
All
This is where impact estimates are calculated for every period for every activity throughout the analytical period. All output tables pull from information estimated here. This sheet is protected by default, but there's no password. If you want to mess around in here just click Unprotect Sheet in the ribbon (under the Review tab):
One reason you might want to unprotect the sheet is to create your own custom pivot tables, e.g., if you want to create more output tables that include other filters beyond what is pre-made in the Annual Impact sheet.
Controls
This contains drop-down lists and the inner workings of the auto-generated one-for-one RIAS text. Altering anything on this page would affect the functionality of the RCC.

