AI-Assisted Quality Control of CTD Data
As part of the suite of Conductivity, Temperature, Depth (CTD) AI tools being produced by the Office of the Chief Data Steward (OCDS), we are developing a model to assist with identifying and deleting poor-quality scans during the CTD quality control process. Using a combination of a Gaussian Mixture Model (GMM) to cluster CTD scans into groups with similar physical properties and Multi-Layer Perceptrons to classify the scans in each group, we are able to automatically flag the poor-quality scans to be deleted with a high degree of accuracy. Through the deployment of the model as a real-time online endpoint and the support of model communication through a client-side program, we have successfully integrated an experimental model into the client's business process in a field testing environment. The continuation of this line of work will now look to bring the model into a production environment for regular usage in the quality control process.
Use Case Objectives
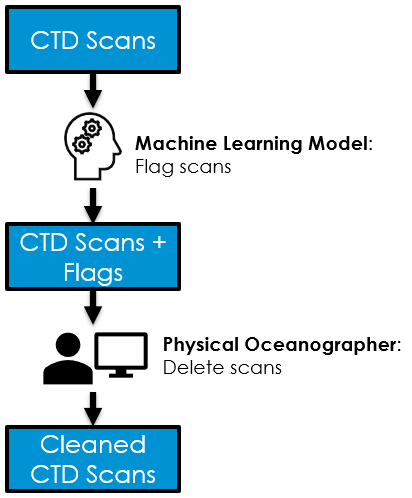
The quality control process for CTD data is a highly time-intensive task. An oceanographer performs a visual inspection to identify poor-quality scans in each CTD profile using graphical editing software. As the task requires careful inspection and the CTD profiles collected during one year number in the thousands, this work consumes a large amount of time and effort. To ease this burden, we have produced an AI tool that is capable of flagging the poor-quality CTD scans such that these flags can be displayed to the oceanographer within the graphical editing software. This allows for the task to be sped up by providing a quick reference for the areas in the CTD profiles where attention is required. By providing flags for assisted decision-making rather than using the model for fully automated decision-making, we preserve the ability of oceanographer to use their domain expertise to make the best possible decisions. As the model becomes more mature and its performance improves, we may explore options to increase the degree of automation.
- Machine Learning Task: Flag in advance the scans to be deleted during CTD quality control
- Business Value: Flagged scans allow the analyst to quickly focus attention on crucial areas, reducing the time and effort required to delete scans
- Measures of Success:
- Accuracy of model predictions
- Client feedback on quality control speed-ups
- Aspirational Goals:
- Mitigation of uncertainty in human decisions
- Semi or full automation of scan deletions
Machine Learning Pipeline
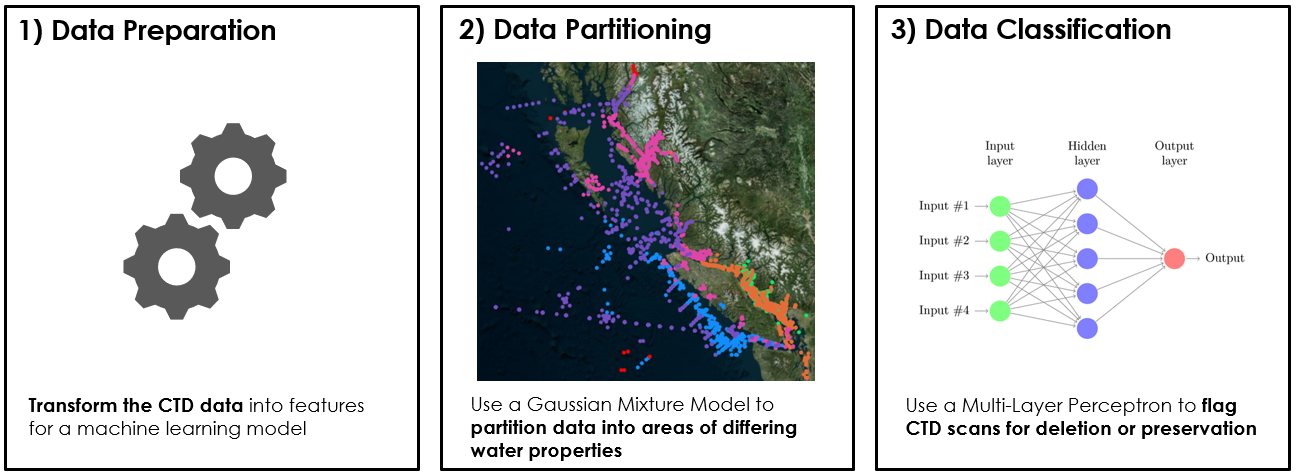
The machine learning pipeline consists of three main steps: data preparation, data partitioning via a Gaussian Mixture Model (GMM) and data classification via a Multi-Layer Perceptron (MLP).
The data preparation covers the standard machine learning tasks of data cleaning, feature engineering and scaling. The feature engineering is used to draw out the most relevant information from the data for later use in the classification task. The MLP classifies each CTD scan independently based on its features. However, the local neighborhood around each scan often contains valuable information about the changes of feature values across the depth-wise dimension of the CTD profile and the rate at which these values are changing. Sudden rapid changes in values can be strong indicators of factors corrupting the data recorded in the CTD scans. We therefore place windows of various sizes around each CTD scan and calculate statistics over the scan values within the window to augment each CTD scan with information about different sized local neighborhoods. Our experimental evaluations have shown these additional features to have a positive impact on the performance of the model.
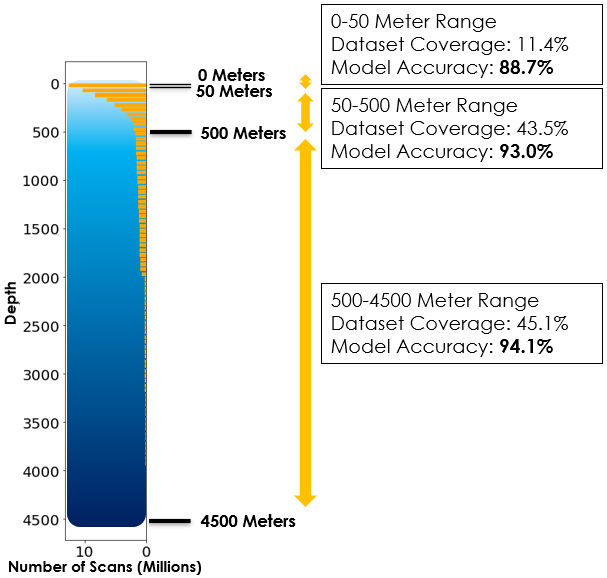
The data partitioning step is used to break the CTD scans up into groups that have similar physical properties to each other. Since the CTD profiles are collected across a vast geographical area (the North-East Pacific), a large span of depths (0 to 4300 meters below surface) and across all seasons, these spatio-temporal variations lead to a highly varied distribution of physical properties in the CTD scans. This degree of variation is difficult for a single MLP to cope with and learn how to distinguish between good or poor-quality scans in all observed conditions. Performance can be greatly improved by first partitioning the scans and then training a separate MLP for each partition. We achieve this using a GMM trained on the primary physical properties of the scans, namely the temperature, conductivity and salinity values.
Finally, data classification is achieved using once MLP per cluster of CTD scans. The MLP is trained for binary classification to flag CTD as poor-quality (to be deleted) or good quality (to be preserved). The ground truth used to produce the training data is derived from historical instances of quality control, using the decisions made by oceanographers in the past on which scans should be deleted. The deleted scans are far fewer than the preserved scans, making the training data highly imbalanced. This is often problematic in a machine learning setting as it causes the model to learn in a fashion biased towards the majority class. To address this, we apply oversampling to randomly duplicate deleted scans in the training data in order to balance their numbers with the preserved scans.
Experimental Model Performance
Model Deployment and Integration


