Business_process.png (412 × 498 pixels, file size: 19 KB, MIME type: image/png)
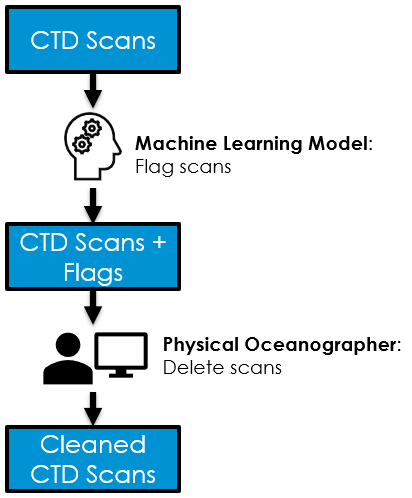
A simple flow diagram depicting how the model fits into the business process. The first box in the diagram represents the input CTD Scans. An arrow shows the scans being passed to the machine learning model. The machine learning model shows the task of flagging the CTD scans. An arrow shows the output from the model, leading to another box denoted as CTD Scans + Flags. An arrow from this box shows that this data is then passed to the expert oceanographer with the task of deleting scans. Finally, a last arrow leads to another box denoting the final output as Cleaned CTD Scans.
File history
Click on a date/time to view the file as it appeared at that time.
| Date/Time | Thumbnail | Dimensions | User | Comment | |
|---|---|---|---|---|---|
| current | 17:39, 16 December 2022 | | 412 × 498 (19 KB) | Lee.croft (talk | contribs) | |
| 16:18, 16 December 2022 | 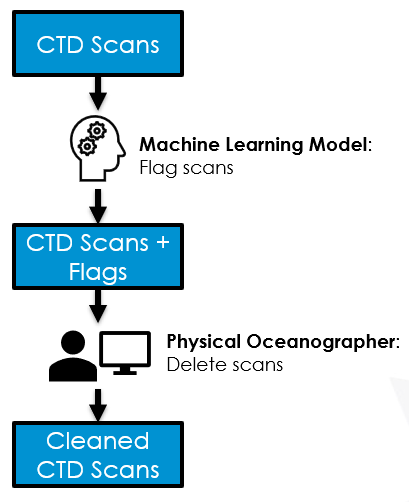 | 409 × 502 (19 KB) | Lee.croft (talk | contribs) |
You cannot overwrite this file.
File usage
The following page uses this file: