File:Bowtie Diagram.png
Revision as of 09:04, 1 August 2025 by Sandra.radons.arneson (talk | contribs)
Size of this preview: 800 × 271 pixels. Other resolutions: 320 × 108 pixels | 2,027 × 687 pixels.
Original file (2,027 × 687 pixels, file size: 40 KB, MIME type: image/png)
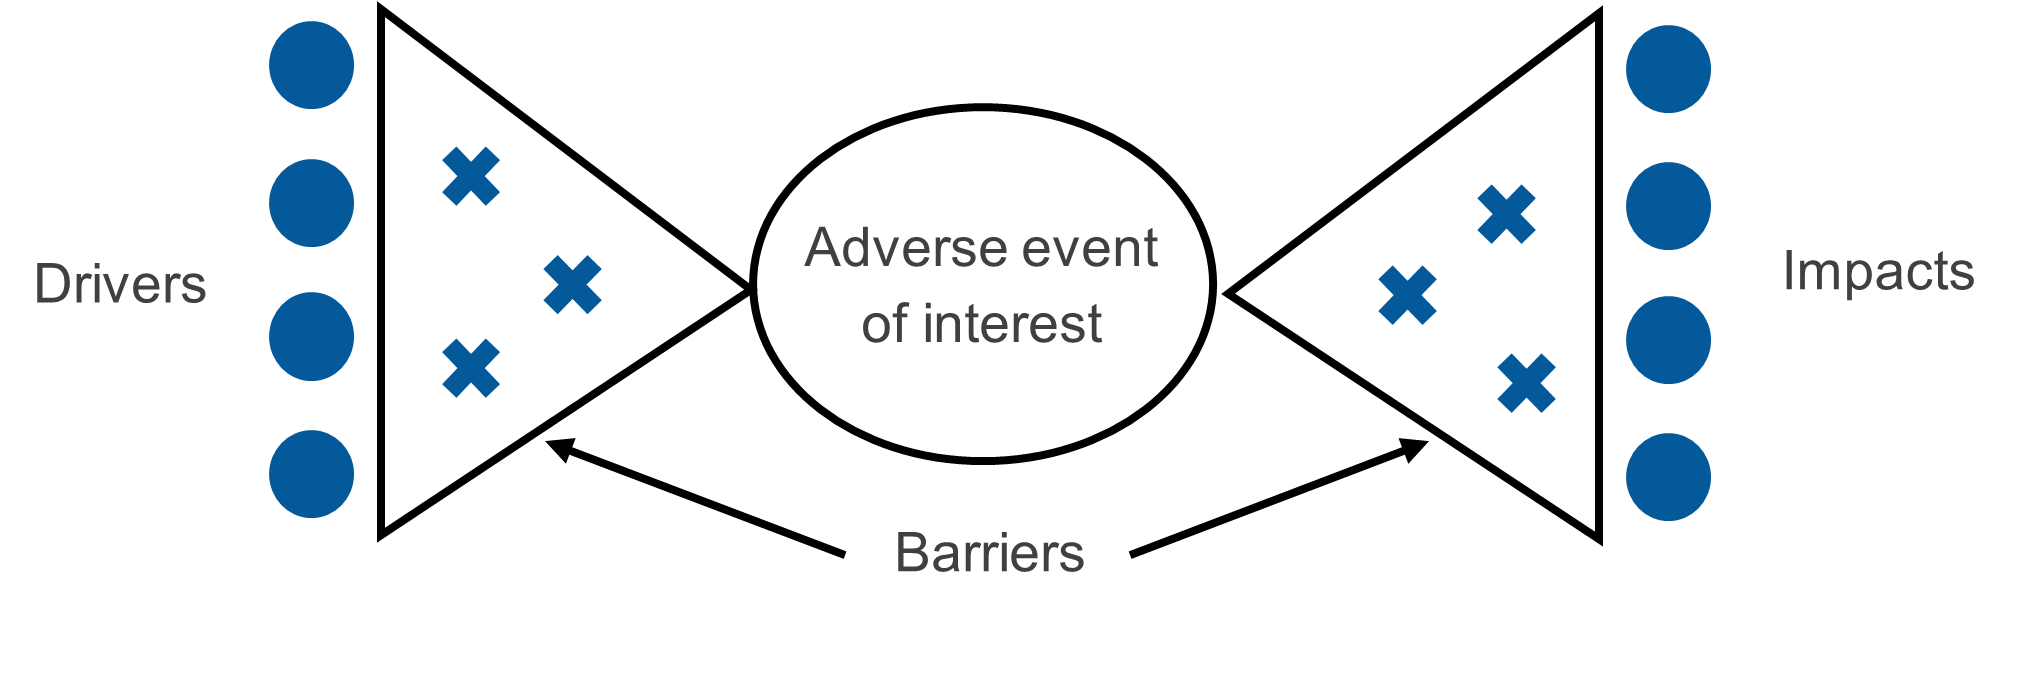
Figure 1: Text description
A bowtie diagram depicting drivers of the adverse event on the left, the center node is the adverse event of interest. To the right are the impacts resulting directly and/or indirectly from the adverse event. Barriers that prevent or mitigate the drivers and impacts of the adverse event are marked along the pathway.
File history
Click on a date/time to view the file as it appeared at that time.
| Date/Time | Thumbnail | Dimensions | User | Comment | |
|---|---|---|---|---|---|
| current | 09:04, 1 August 2025 | 2,027 × 687 (40 KB) | Sandra.radons.arneson (talk | contribs) |
You cannot overwrite this file.
File usage
There are no pages that use this file.